| Just to further piggyback,
Probably the most "hard" the mgr seems to get pushed is when the balancer is engaged. When trying to eval a pool or cluster, it takes upwards of 30-120 seconds for it to score it, and then another 30-120 seconds to execute the plan, and it never seems to engage automatically.
$ time ceph balancer status { "active": true, "plans": [], "mode": "upmap" }
real 0m36.490s user 0m0.259s sys 0m0.044s
I'm going to disable mine as well, and see if I can stop waking up to 'No Active MGR.'
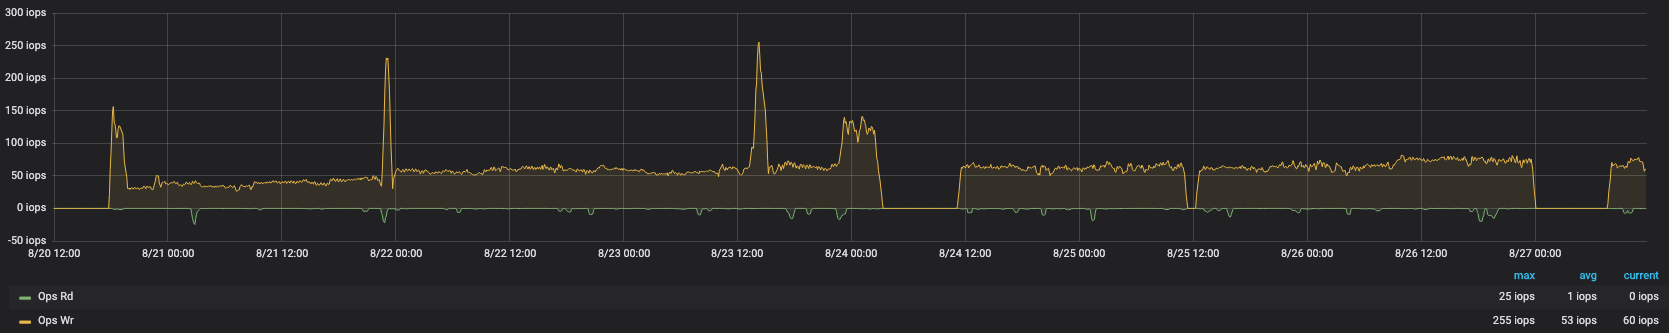
You can see when I lose mgr's because RBD image stats go to 0 until I catch it.
Thanks,
Reed
Hi Reed, Lenz, John I've just tried disabling the balancer, so far ceph-mgr is keeping it's CPU mostly under 20%, even with both the iostat and dashboard back on. # ceph balancer off was [root@ceph-s1 backup]# ceph balancer status { "active": true, "plans": [], "mode": "upmap" } now [root@ceph-s1 backup]# ceph balancer status { "active": false, "plans": [], "mode": "upmap" } We are using 8:2 erasure encoding across 324 12TB OSD, plus 4 NVMe OSD for a replicated cephfs metadata pool. let me know if the balancer is your problem too... best, Jake On 8/27/19 3:57 PM, Jake Grimmett wrote: Yes, the problem still occurs with the dashboard disabled...
Possibly relevant, when both the dashboard and iostat plugins are
disabled, I occasionally see ceph-mgr rise to 100% CPU.
as suggested by John Hearns, the output of gstack ceph-mgr when at 100%
is here:
http://p.ip.fi/52sV
many thanks
Jake
On 8/27/19 3:09 PM, Reed Dier wrote:
I'm currently seeing this with the dashboard disabled.
My instability decreases, but isn't wholly cured, by disabling
prometheus and rbd_support, which I use in tandem, as the only thing I'm
using the prom-exporter for is the per-rbd metrics.
ceph mgr module ls
{
"enabled_modules": [
"diskprediction_local",
"influx",
"iostat",
"prometheus",
"rbd_support",
"restful",
"telemetry"
],
I'm on Ubuntu 18.04, so that doesn't corroborate with some possible OS
correlation.
Thanks,
Reed
On Aug 27, 2019, at 8:37 AM, Lenz Grimmer <lgrimmer@xxxxxxxx
<mailto:lgrimmer@xxxxxxxx>> wrote:
Hi Jake,
On 8/27/19 3:22 PM, Jake Grimmett wrote:
That exactly matches what I'm seeing:
when iostat is working OK, I see ~5% CPU use by ceph-mgr
and when iostat freezes, ceph-mgr CPU increases to 100%
Does this also occur if the dashboard module is disabled? Just wondering
if this is isolatable to the iostat module. Thanks!
Lenz
--
SUSE Software Solutions Germany GmbH - Maxfeldstr. 5 - 90409 Nuernberg
GF: Felix Imendörffer, HRB 247165 (AG Nürnberg)
_______________________________________________
ceph-users mailing list
ceph-users@xxxxxxxxxxxxxx <mailto:ceph-users@xxxxxxxxxxxxxx>
http://lists.ceph.com/listinfo.cgi/ceph-users-ceph.com
_______________________________________________
ceph-users mailing list
ceph-users@xxxxxxxxxxxxxx
http://lists.ceph.com/listinfo.cgi/ceph-users-ceph.com
-- MRC Laboratory of Molecular Biology Francis Crick Avenue, Cambridge CB2 0QH, UK.
|