I tried your vcd file and I can view it with no problems. Did you select
all signals and then press the insert button in gtkwave?
I run fedora 10 with gtkwave version 'GTKWave Analyzer v3.1.13
(w)1999-2008 BSI'.
   Herman.


GeunSik Lim wrote:
On Fri, Jun 5, 2009 at 3:58 AM, Herman ten
Brugge<hermantenbrugge@xxxxxxx> wrote:
I have written some code to convert the ascii sched_switch output to
vcd format (value change data). Now it is possible to view the context
switches in a vcd viewer. I personally use gtkwave because it is free
and is present in the fedora repository.
To use this program first make a ftrace file with something like:
Hi Herman ten Brugge,
Thansk you for sharing your code to visualize sched_switch ftrace data
with vcd viewer like GTKWave.
This is my H/W requirements.
* core: Core2 Quad Q9300
* Memory: DDR3G
* Kernel: 2.6.29-3.fc10.i686.smp kernel
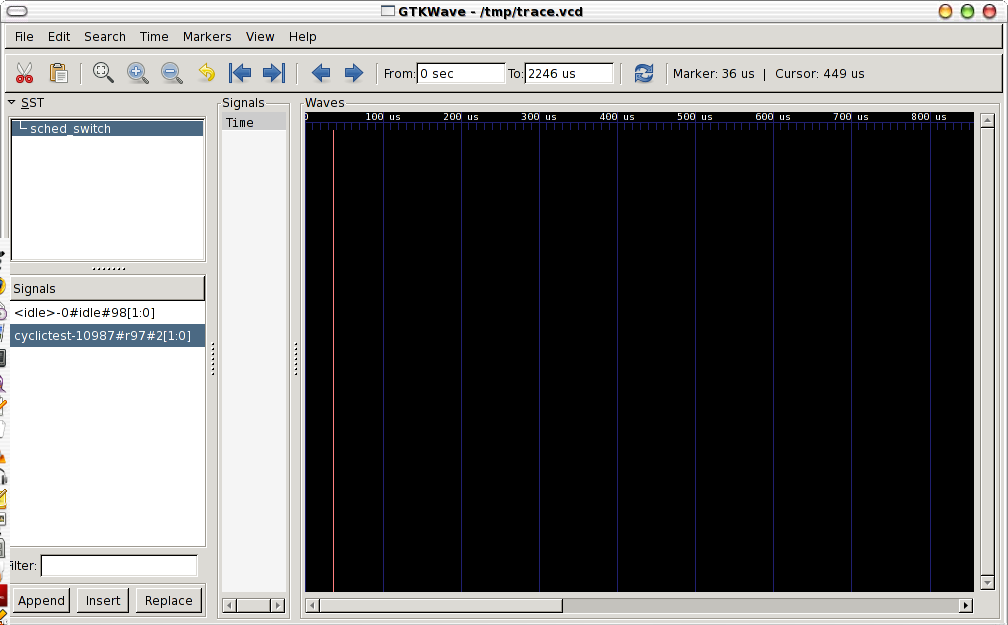
I tested in my fedora 9 distribution with below methods.
But I can not show normal result using "#> gtkware trace.vcd" command.
* screenshot : http://blogfiles5.naver.net/data43/2009/6/12/228/gtkwave-vcd-20090609.1503-invain.png
It seems that you have to update your code for stablization and
functions continually.
F-Geunsik#> wget http://www.osadl.org/uploads/media/sched_switch-0.1.tgz
F-Geunsik#> tar -zxvf sched_switch-0.1.tgz
F-Geunsik#> cd sched_switch-0.1
F-Geunsik#> make
F-Geunsik#> cp ./sched_switch /usr/bin/
F-Geunsik#> cd /syskerneldebug/tracing/
F-Geunsik#> echo sched_switch >current_tracer
F-Geunsik#> echo 1 >tracing_enable
F-Geunsik#> chrt -f 20 sleep 5
F-Geunsik#> cyclictest -t 5 -p 99 -d 60 -i 1000
F-Geunsik#> echo 0 >tracing_enable
F-Geunsik#> cat trace >/tmp/trace.txt
F-Geunsik#> /usr/bin/sched_switch /tmp/trace.txt /tmp/trace.vcd
F-Geunsik#> yum install gtkwave
F-Geunsik#> gtkwave /tmp/trace.vcd
--
To unsubscribe from this list: send the line "unsubscribe linux-rt-users" in
the body of a message to majordomo@xxxxxxxxxxxxxxx
More majordomo info at  http://vger.kernel.org/majordomo-info.html
