On 07.08.2013 10:57, Erwan Velu wrote:
On 06/08/2013 23:59, Dennis Jacobfeuerborn wrote:[..] How does the fio2gnuplot tool work? There is no man page or example invocation that explains how to generate the plots. I tried "fio2gnuplot --iops" but that only dumps the usage options without any hint of what is wrong with that call.Dear Dennis, I'm sorry the inline help of fio2gnuplot isn't sufficient yet to get understood easily, I'll work on fixing this. Anyway, here come how it works : While running fio jobs, you are producing a set of log files located in a directory. When considering a good amount of logs, logs file are usually having different filename to remember what log match a particular run. i.e genfio does works this way ;o) Then, when you want to plot some fio's output, you have to call fio2gnuplot with a 'pattern' (-p) option. The pattern is a kind of regexp that allow you to choose what file you want to plot. Mostly, I do use the '*' for this purpose. Let's say you have four files named like : host1-read-4k_iops.log host2-read-4k_iops.log host3-read-4k_iops.log host1-write-4k_iops.log If you want to plot all the traces related to the reading you'll do : fio2gnuplot -p 'host*-read-4k_iops.log' Note the single quote to avoid the shell interpreting the star (*), it's up to fio2gnuplot to handle this. Then, if you want to generate the rendering, you can use the '-g' flag to request the plotting (maybe this could be a default option). Then, you can choose in which dir you want plot all this stuff, let's use the '-d' option. fio2gnuplot generates a _lot_ of traces, so that's a recommanded option. So a typical cmdline would be : fio2gnuplot -p 'host*-read-4k_iops.log' -g -d read-4k About the --iops output you choose, it's just a predefined pattern that match all the "iops" files from the current directory. In fact, I didn't used them a lot .... a you spotted two nice bugs I shoudn't have commit. First, it does print the help while the cmdline wasn't correct. It should have told you something was wrong on the cmdline. Then, the --iops wasn't properly managed and as a result didn't got supported... .What a shame... Please make a try with '-i' on this version of the tool. To fix this two bugs, I've been pushing two fixes in my dev tree that I'll ask to merge a little bit later. If you want to test them, that's available here : https://github.com/enovance/fio/commits/erwan/next I do agree that I should had a man page and much more example. Thanks for testing my work & reporting.
Thanks for providing the script. I'm currently looking at using fio to create a few baseline test to get a quick glimpse of how fast a given system can do certain I/O patterns and being able to graph this would make it easier to compare the results.
I tested the version from the erwan/next branch and the --iops option works now and if I don't provide it I get a proper error. Although when I provide a nonsense option like "--fnsofno" I get the error "Error: One of the option passed to the cmdline was supported". That is probably supposed to say "was not supported".
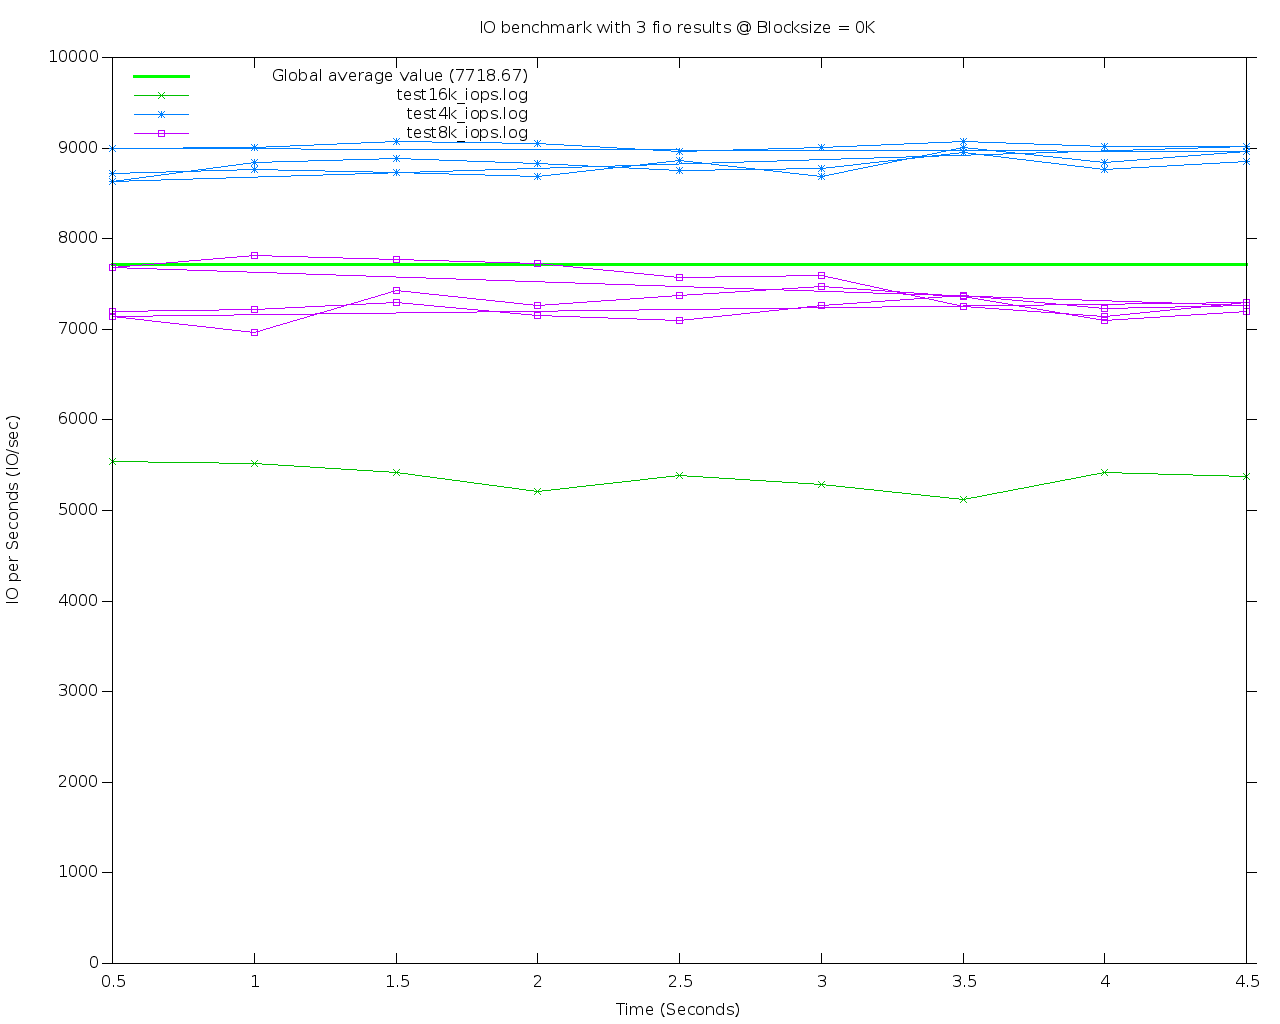
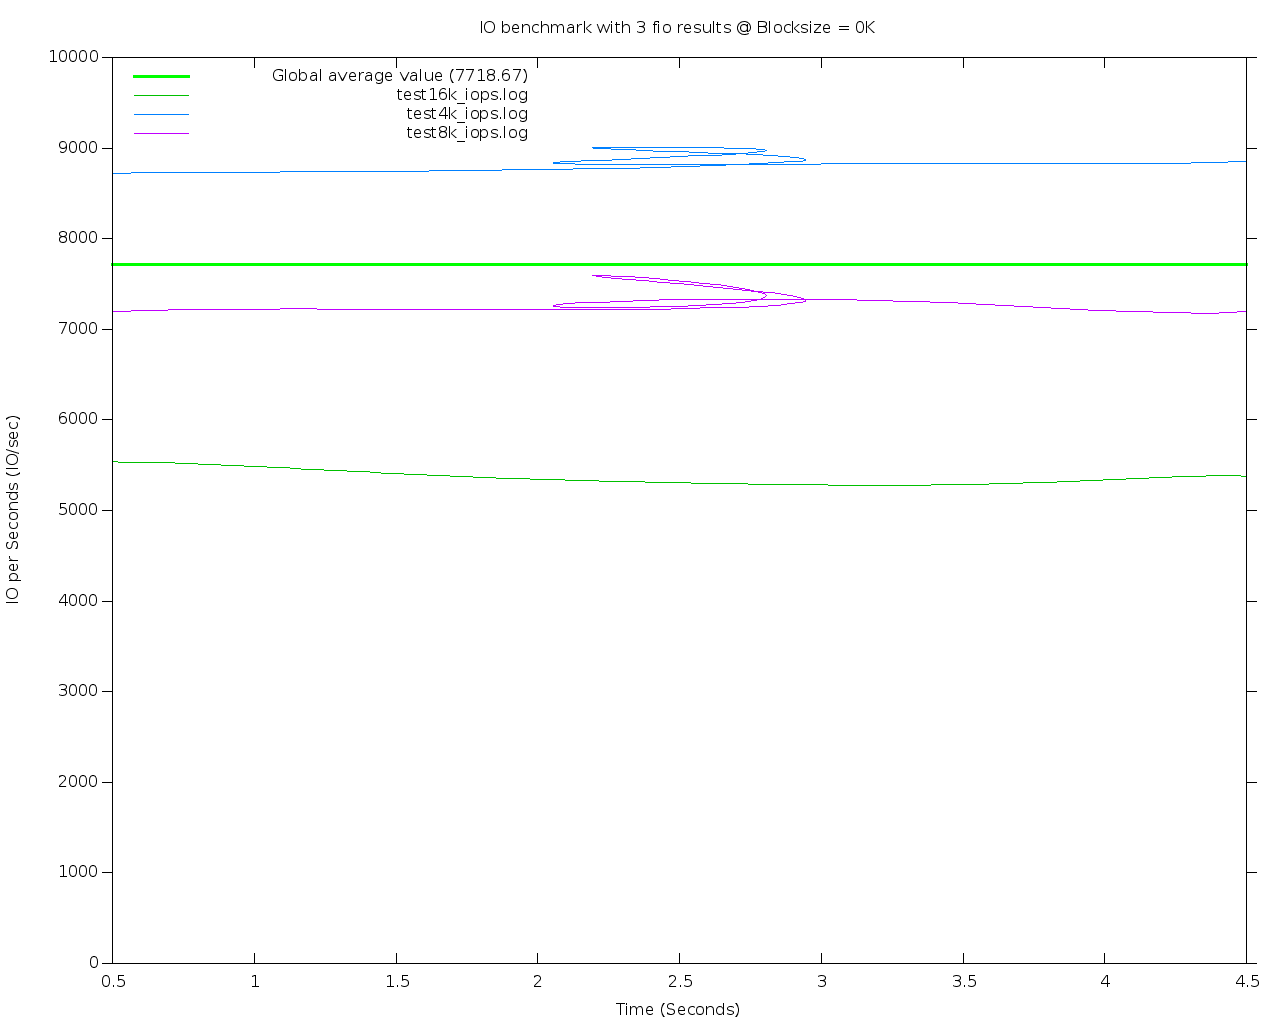
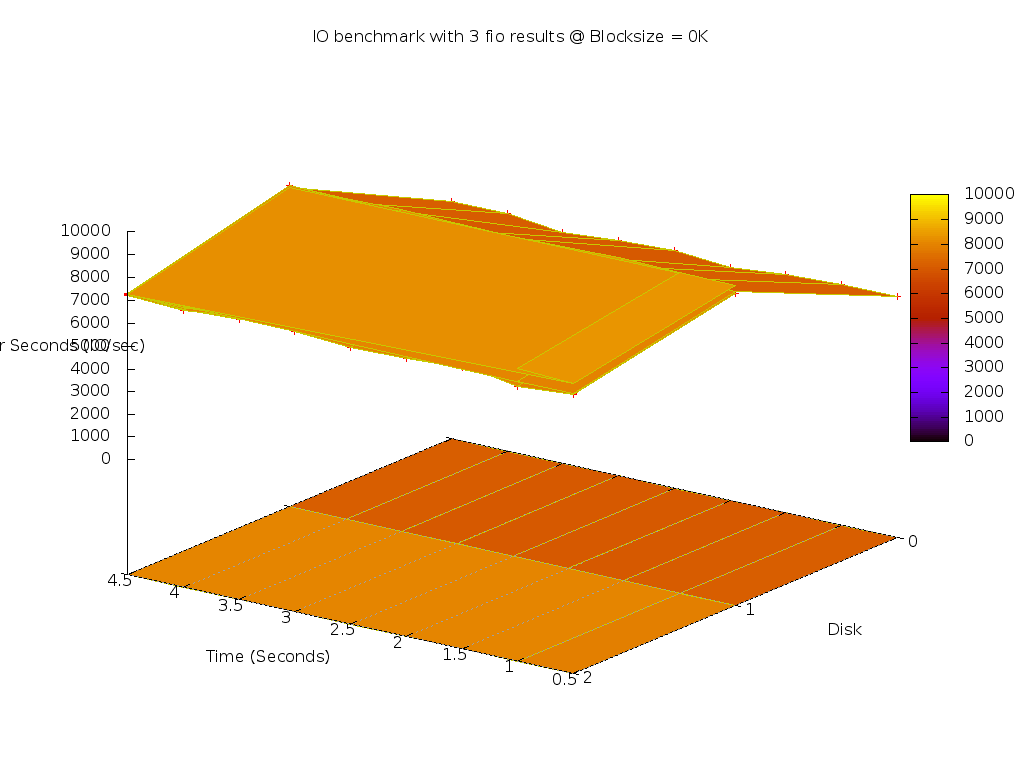
The graphing seems to have issues too. I attached a job file and the graphs generated using "./fio2gnuplot.py -d t -g -i". As you can see in the compare-2Draw graph I get multiple lines for the test4k and test8k jobs but not for the test16k job and in the compare-2Dtrend graph I get strange loops for the same two out of three jobs. The 3D graph looks strange too and shows "disks" which doesn't really apply in this particular case.
Lastly the tool does output a lot of things by default which are probably not useful to 99.9% of the people out there. I think the default should be to only output the 2Draw and the 3D graph and delete the data files (mygraph, mymath, etc.) and allow the user to keep these files and create the additional graphs using command line options. In fact in the case of multiple input files it would probably be best to only end up with the compate-2Draw graph as the graphs for the individual jobs are pretty much redundant in that case.
Regards,
  Dennis
Attachment:
compare-result-2Draw.png
Description: PNG image
Attachment:
compare-result-2Dtrend.png
Description: PNG image
Attachment:
result-3D.png
Description: PNG image
[global]
rw=randread
direct=1
filename=/dev/sda
numjobs=1
group_reporting=1
runtime=5

[randread]
bs=4k
write_iops_log=test4k
log_avg_msec=200
stonewall

[randread2]
bs=8k
write_iops_log=test8k
log_avg_msec=200
stonewall

[randread3]
bs=16k
write_iops_log=test16k
log_avg_msec=200
stonewall
