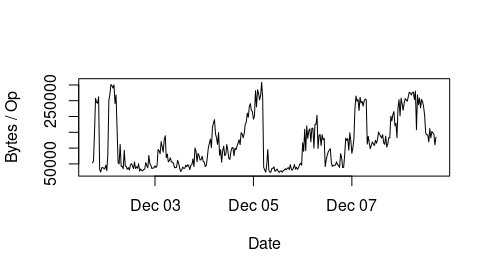
Hi Xiubo,

Thanks very much for looking into this, that does sound like what might
be happening in our case.

Is this something that can be improved somehow - would disabling pinning or
some config change help? Or could this be addressed in a future release?

It seems somehow excessive to write so much metadata for each operation, it
makes metadata operations constrained by the disk capacity. We were happy
to use pinning as it's very natural for us and seems to make the FS more
stable, however the metadata bandwidth usage is becoming a real issue.

Thanks very much for your help,

Kind regards,

András


On Thu, Dec 16, 2021, 03:43 Xiubo Li <xiubli@xxxxxxxxxx> wrote:

> I have figured out one case may could cause this, please see the tracker
> https://tracker.ceph.com/issues/53623.
>
> Just in case that there has a large number of subtrees in mds.0 and the
> size of ESubtreeMap event could reach up to 4MB. Then it's possibly that
> for each LogSegment will only contain 2 event, that means when the an MDS
> is submitting each new event, it's possibly will use a whole LogSegment.
>
> I think the most of handwidth usage could be writing the ESubtreeMap
> events to metadata pool.
>
> -- Xiubo
>
>
>
>
> On 12/13/21 9:52 PM, Gregory Farnum wrote:
>
> I see Xiubo started discussing this onhttps://tracker.ceph.com/issues/53542 as well.
>
> So the large writes are going to the journal file, and sometimes it's
> s single write of a full segment size, which is what I was curious
> about.
>
> At this point the next step is seeing what is actually taking up that
> space. You could turn up logging and send in a snippet, but I think
> the easiest thing is going to involve:
> * track one of those 4 MB full-object writes
> Either a) pull the object in question off disk and look at it using
> ceph-dencoder, or
> b) Use cephfs-journal-tool to inspect the relevant journal range
>
> From your output below you could grab 200.02c7a084 (which is at
> journal offset 0x2c7a084*4MiB), though that's probably been expired by
> this point so you'll need to get another dump which contains a large
> one. I haven't looked at these data structures using these tools in a
> while so I'll leave more detail up to Xiubo.
> -Greg
>
> On Fri, Dec 10, 2021 at 12:48 AM Andras Sali <sali.andrew@xxxxxxxxx> <sali.andrew@xxxxxxxxx> wrote:
>
> Hi Greg,
>
> As a follow up, we see items similar to this pop up in the objecter_requests (when it's not empty). Not sure if reading it right, but some appear quite large (in the MB range?):
>
> {
>     "ops": [
>         {
>             "tid": 9532804,
>             "pg": "3.f9c235d7",
>             "osd": 2,
>             "object_id": "200.02c7a084",
>             "object_locator": "@3",
>             "target_object_id": "200.02c7a084",
>             "target_object_locator": "@3",
>             "paused": 0,
>             "used_replica": 0,
>             "precalc_pgid": 0,
>             "last_sent": "1121127.434264s",
>             "age": 0.016000104000000001,
>             "attempts": 1,
>             "snapid": "head",
>             "snap_context": "0=[]",
>             "mtime": "2021-12-10T08:35:34.582215+0000",
>             "osd_ops": [
>                 "write 0~4194304 [fadvise_dontneed] in=4194304b"
>             ]
>         },
>         {
>             "tid": 9532806,
>             "pg": "3.abba2e66",
>             "osd": 2,
>             "object_id": "200.02c7a085",
>             "object_locator": "@3",
>             "target_object_id": "200.02c7a085",
>             "target_object_locator": "@3",
>             "paused": 0,
>             "used_replica": 0,
>             "precalc_pgid": 0,
>             "last_sent": "1121127.438264s",
>             "age": 0.012000078000000001,
>             "attempts": 1,
>             "snapid": "head",
>             "snap_context": "0=[]",
>             "mtime": "2021-12-10T08:35:34.589044+0000",
>             "osd_ops": [
>                 "write 0~1236893 [fadvise_dontneed] in=1236893b"
>             ]
>         },
>         {
>             "tid": 9532807,
>             "pg": "3.abba2e66",
>             "osd": 2,
>             "object_id": "200.02c7a085",
>             "object_locator": "@3",
>             "target_object_id": "200.02c7a085",
>             "target_object_locator": "@3",
>             "paused": 0,
>             "used_replica": 0,
>             "precalc_pgid": 0,
>             "last_sent": "1121127.442264s",
>             "age": 0.0080000520000000006,
>             "attempts": 1,
>             "snapid": "head",
>             "snap_context": "0=[]",
>             "mtime": "2021-12-10T08:35:34.592283+0000",
>             "osd_ops": [
>                 "write 1236893~510649 [fadvise_dontneed] in=510649b"
>             ]
>         },
>         {
>             "tid": 9532808,
>             "pg": "3.abba2e66",
>             "osd": 2,
>             "object_id": "200.02c7a085",
>             "object_locator": "@3",
>             "target_object_id": "200.02c7a085",
>             "target_object_locator": "@3",
>             "paused": 0,
>             "used_replica": 0,
>             "precalc_pgid": 0,
>             "last_sent": "1121127.442264s",
>             "age": 0.0080000520000000006,
>             "attempts": 1,
>             "snapid": "head",
>             "snap_context": "0=[]",
>             "mtime": "2021-12-10T08:35:34.592387+0000",
>             "osd_ops": [
>                 "write 1747542~13387 [fadvise_dontneed] in=13387b"
>             ]
>         }
>     ],
>     "linger_ops": [],
>     "pool_ops": [],
>     "pool_stat_ops": [],
>     "statfs_ops": [],
>     "command_ops": []
> }
>
> Any suggestions would be much appreciated.
>
> Kind regards,
>
> András
>
>
> On Thu, Dec 9, 2021 at 7:48 PM Andras Sali <sali.andrew@xxxxxxxxx> <sali.andrew@xxxxxxxxx> wrote:
>
> Hi Greg,
>
> Much appreciated for the reply, the image is also available at: https://tracker.ceph.com/attachments/download/5808/Bytes_per_op.png
>
> How the graph is generated: we back the cephfs metadata pool with Azure ultrassd disks. Azure reports for the disks each minute the average read/write iops (operations per sec) and average read/write throughput (in bytes per sec).
>
> We then divide the write throughput with the write IOPS number - this is the average write bytes / operation (we plot this in the above graph). We observe that this increases up to around 300kb, whilst after resetting the MDS, it stays around 32kb for some time (then starts increasing). The read bytes / operation are constantly much smaller.
>
> The issue is that once we are in the "high" regime, for the same operation that does for example 1000 IOPS, we need 300MB throughput, instead of 30MB throughput that we observe after a restart. The high throughput often results in reaching the VM level limits in Azure and after this the queue depth explodes and operations begin stalling.
>
> We will do the dump and report it as well once we have it.
>
> Thanks again for any ideas on this.
>
> Kind regards,
>
> Andras
>
>
> On Thu, Dec 9, 2021, 15:07 Gregory Farnum <gfarnum@xxxxxxxxxx> <gfarnum@xxxxxxxxxx> wrote:
>
> Andras,
>
> Unfortunately your attachment didn't come through the list. (It might
> work if you embed it inline? Not sure.) I don't know if anybody's
> looked too hard at this before, and without the image I don't know
> exactly what metric you're using to say something's 320KB in size. Can
> you explain more?
>
> It might help if you dump the objecter_requests from the MDS and share
> those — it'll display what objects are being written to with what
> sizes.
> -Greg
>
>
> On Wed, Dec 8, 2021 at 9:00 AM Andras Sali <sali.andrew@xxxxxxxxx> <sali.andrew@xxxxxxxxx> wrote:
>
> Hi All,
>
> We have been observing that if we let our MDS run for some time, the
> bandwidth usage of the disks in the metadata pool starts increasing
> significantly (whilst IOPS is about constant), even though the number of
> clients, the workloads or anything else doesn't change.
>
> However, after restarting the MDS, the issue goes away for some time and
> the same workloads require 1/10th of the metadata disk bandwidth whilst
> doing the same IOPS.
>
> We run our CephFS cluster in a cloud environment where the disk throughput
> / bandwidth capacity is quite expensive to increase and we are hitting
> bandwidth / throughput limits, even though we still have a lot of IOPS
> capacity left.
>
> We suspect that somehow the journaling of the MDS becomes more extensive
> (i.e. larger journal updates for each operation), but we couldn't really
> pin down which parameter might affect this.
>
> I attach a plot of how the Bytes / Operation (throughput in MBps / IOPS)
> evolves over time, when we restart the MDS, it drops to around 32kb (even
> though the min block size for the metadata pool OSDs is 4kb in our
> settings) and then increases over time to around 300kb.
>
> Any ideas on how to "fix" this and have a significantly lower bandwidth
> usage would be really-really appreciated!
>
> Thank you and kind regards,
>
> Andras
> _______________________________________________
> ceph-users mailing list -- ceph-users@xxxxxxx
> To unsubscribe send an email to ceph-users-leave@xxxxxxx
>
>
_______________________________________________
ceph-users mailing list -- ceph-users@xxxxxxx
To unsubscribe send an email to ceph-users-leave@xxxxxxx
 |