Hi Greg,
As a follow up, we see items similar to this pop up in the
objecter_requests (when it's not empty). Not sure if reading it right, but
some appear quite large (in the MB range?):
{
"ops": [
{
"tid": 9532804,
"pg": "3.f9c235d7",
"osd": 2,
"object_id": "200.02c7a084",
"object_locator": "@3",
"target_object_id": "200.02c7a084",
"target_object_locator": "@3",
"paused": 0,
"used_replica": 0,
"precalc_pgid": 0,
"last_sent": "1121127.434264s",
"age": 0.016000104000000001,
"attempts": 1,
"snapid": "head",
"snap_context": "0=[]",
"mtime": "2021-12-10T08:35:34.582215+0000",
"osd_ops": [
"write 0~4194304 [fadvise_dontneed] in=4194304b"
]
},
{
"tid": 9532806,
"pg": "3.abba2e66",
"osd": 2,
"object_id": "200.02c7a085",
"object_locator": "@3",
"target_object_id": "200.02c7a085",
"target_object_locator": "@3",
"paused": 0,
"used_replica": 0,
"precalc_pgid": 0,
"last_sent": "1121127.438264s",
"age": 0.012000078000000001,
"attempts": 1,
"snapid": "head",
"snap_context": "0=[]",
"mtime": "2021-12-10T08:35:34.589044+0000",
"osd_ops": [
"write 0~1236893 [fadvise_dontneed] in=1236893b"
]
},
{
"tid": 9532807,
"pg": "3.abba2e66",
"osd": 2,
"object_id": "200.02c7a085",
"object_locator": "@3",
"target_object_id": "200.02c7a085",
"target_object_locator": "@3",
"paused": 0,
"used_replica": 0,
"precalc_pgid": 0,
"last_sent": "1121127.442264s",
"age": 0.0080000520000000006,
"attempts": 1,
"snapid": "head",
"snap_context": "0=[]",
"mtime": "2021-12-10T08:35:34.592283+0000",
"osd_ops": [
"write 1236893~510649 [fadvise_dontneed] in=510649b"
]
},
{
"tid": 9532808,
"pg": "3.abba2e66",
"osd": 2,
"object_id": "200.02c7a085",
"object_locator": "@3",
"target_object_id": "200.02c7a085",
"target_object_locator": "@3",
"paused": 0,
"used_replica": 0,
"precalc_pgid": 0,
"last_sent": "1121127.442264s",
"age": 0.0080000520000000006,
"attempts": 1,
"snapid": "head",
"snap_context": "0=[]",
"mtime": "2021-12-10T08:35:34.592387+0000",
"osd_ops": [
"write 1747542~13387 [fadvise_dontneed] in=13387b"
]
}
],
"linger_ops": [],
"pool_ops": [],
"pool_stat_ops": [],
"statfs_ops": [],
"command_ops": []
}
Any suggestions would be much appreciated.
Kind regards,
András
On Thu, Dec 9, 2021 at 7:48 PM Andras Sali <sali.andrew@xxxxxxxxx> wrote:
> Hi Greg,
>
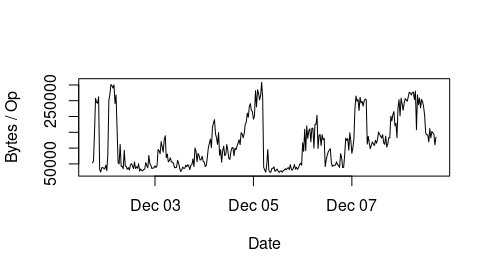
> Much appreciated for the reply, the image is also available at:
> https://tracker.ceph.com/attachments/download/5808/Bytes_per_op.png
>
> How the graph is generated: we back the cephfs metadata pool with Azure
> ultrassd disks. Azure reports for the disks each minute the average
> read/write iops (operations per sec) and average read/write throughput (in
> bytes per sec).
>
> We then divide the write throughput with the write IOPS number - this is
> the average write bytes / operation (we plot this in the above graph). We
> observe that this increases up to around 300kb, whilst after resetting the
> MDS, it stays around 32kb for some time (then starts increasing). The read
> bytes / operation are constantly much smaller.
>
> The issue is that once we are in the "high" regime, for the same operation
> that does for example 1000 IOPS, we need 300MB throughput, instead of 30MB
> throughput that we observe after a restart. The high throughput often
> results in reaching the VM level limits in Azure and after this the queue
> depth explodes and operations begin stalling.
>
> We will do the dump and report it as well once we have it.
>
> Thanks again for any ideas on this.
>
> Kind regards,
>
> Andras
>
>
> On Thu, Dec 9, 2021, 15:07 Gregory Farnum <gfarnum@xxxxxxxxxx> wrote:
>
>> Andras,
>>
>> Unfortunately your attachment didn't come through the list. (It might
>> work if you embed it inline? Not sure.) I don't know if anybody's
>> looked too hard at this before, and without the image I don't know
>> exactly what metric you're using to say something's 320KB in size. Can
>> you explain more?
>>
>> It might help if you dump the objecter_requests from the MDS and share
>> those — it'll display what objects are being written to with what
>> sizes.
>> -Greg
>>
>>
>> On Wed, Dec 8, 2021 at 9:00 AM Andras Sali <sali.andrew@xxxxxxxxx> wrote:
>> >
>> > Hi All,
>> >
>> > We have been observing that if we let our MDS run for some time, the
>> > bandwidth usage of the disks in the metadata pool starts increasing
>> > significantly (whilst IOPS is about constant), even though the number of
>> > clients, the workloads or anything else doesn't change.
>> >
>> > However, after restarting the MDS, the issue goes away for some time and
>> > the same workloads require 1/10th of the metadata disk bandwidth whilst
>> > doing the same IOPS.
>> >
>> > We run our CephFS cluster in a cloud environment where the disk
>> throughput
>> > / bandwidth capacity is quite expensive to increase and we are hitting
>> > bandwidth / throughput limits, even though we still have a lot of IOPS
>> > capacity left.
>> >
>> > We suspect that somehow the journaling of the MDS becomes more extensive
>> > (i.e. larger journal updates for each operation), but we couldn't really
>> > pin down which parameter might affect this.
>> >
>> > I attach a plot of how the Bytes / Operation (throughput in MBps / IOPS)
>> > evolves over time, when we restart the MDS, it drops to around 32kb
>> (even
>> > though the min block size for the metadata pool OSDs is 4kb in our
>> > settings) and then increases over time to around 300kb.
>> >
>> > Any ideas on how to "fix" this and have a significantly lower bandwidth
>> > usage would be really-really appreciated!
>> >
>> > Thank you and kind regards,
>> >
>> > Andras
>> > _______________________________________________
>> > ceph-users mailing list -- ceph-users@xxxxxxx
>> > To unsubscribe send an email to ceph-users-leave@xxxxxxx
>> >
>>
>>
_______________________________________________
ceph-users mailing list -- ceph-users@xxxxxxx
To unsubscribe send an email to ceph-users-leave@xxxxxxx
