Hello!
On Sunday my server hanged, but was not completely dead. I could ping
it, but couldn't login via ssh. In monitoring I could see that server
is still sending data to collectd agent on remote node, and what is
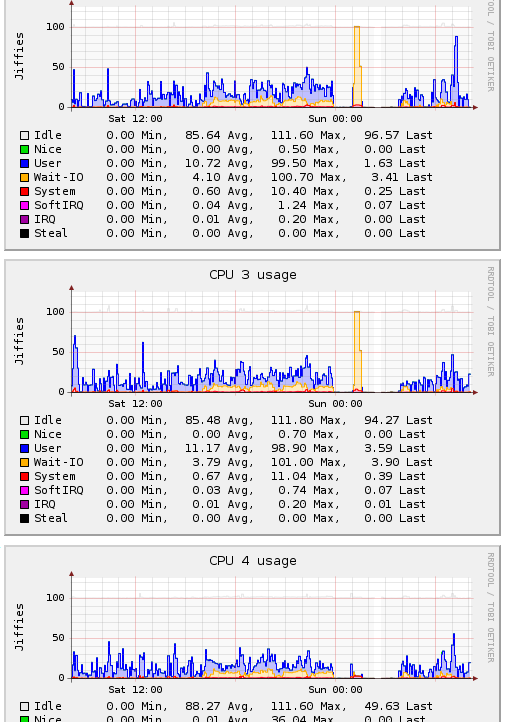
more interesting, I've seen several cpus spending all time in iowait,
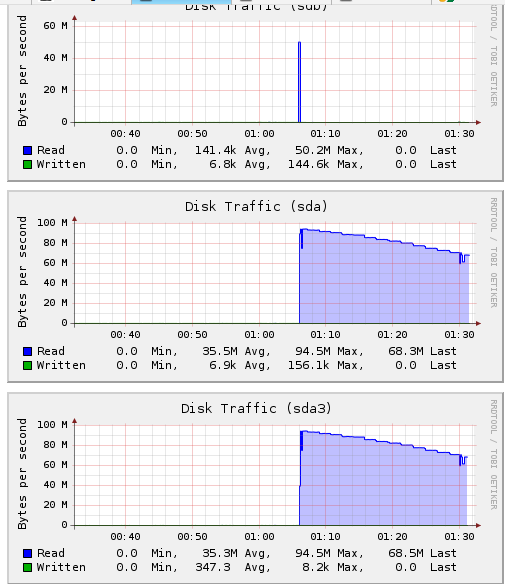
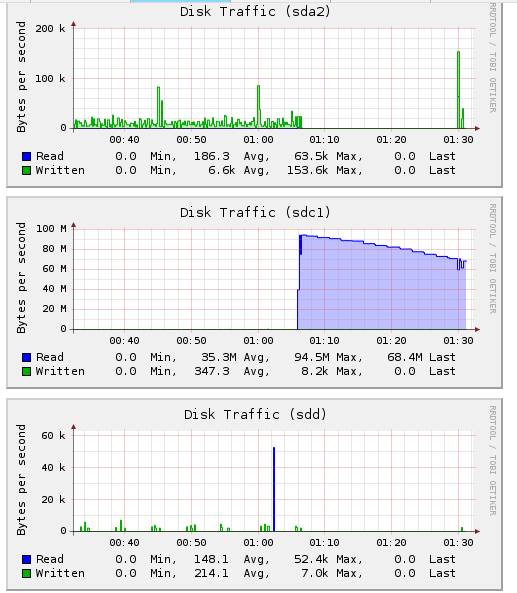
and 2 drives were issuing a lot of read commands.
My disk partitioning is: lvm over 2 raid1 arrays, md2 & md3.
---- cut ----
[07:09:49]root@maindb:~# pvs
PV VG Fmt Attr PSize PFree
/dev/md2 lvmdb lvm2 a- 134.65G 52.15G
/dev/md3 lvmdb lvm2 a- 134.65G 52.15G
[07:09:57]root@maindb:~# cat /proc/mdstat
Personalities : [raid1]
md2 : active raid1 sda3[0] sdc1[1]
141195200 blocks [2/2] [UU]
md3 : active raid1 sdb3[0] sdd1[1]
141195200 blocks [2/2] [UU]
md1 : active raid1 sda2[0] sdb2[1]
1951808 blocks [2/2] [UU]
md0 : active raid1 sda1[0] sdb1[1]
489856 blocks [2/2] [UU]
unused devices: <none>
------ end of cut ----
Underlying hard drives and controller:
--- cut ---
[ 1.528456] aic94xx: found Adaptec AIC-9410W SAS/SATA Host Adapter,
device 0000:04:02.0
[ 1.528544] scsi0 : aic94xx
[ 1.548948] aic94xx: Found sequencer Firmware version 1.1 (V17/10c6)
[ 1.597254] aic94xx: device 0000:04:02.0: SAS addr
5003048000241770, PCBA SN ORG, 8 phys, 8 enabled phys, flash present,
BIOS build 1822
[ 1.605186] scsi 0:0:0:0: Direct-Access FUJITSU MAX3147RC
0104 PQ: 0 ANSI: 3
[ 1.059426] scsi 0:0:1:0: Direct-Access FUJITSU MBA3147RC
0103 PQ: 0 ANSI: 5
[ 1.233381] scsi 0:0:2:0: Direct-Access FUJITSU MBA3147RC
0103 PQ: 0 ANSI: 5
[ 1.235496] scsi 0:0:3:0: Direct-Access FUJITSU MAX3147RC
0104 PQ: 0 ANSI: 3
--- end of cut ---
Active reading occurred on sda3 & sdc1 (md2) while other drives were
idling. That was strange and while i was thinking what it can be,
server unhanged and let me in.
When I logged in, I've seen:
[02:15:10]coolcold@maindb:~$ cat /proc/mdstat
Personalities : [raid1]
md2 : active raid1 sda3[0] sdc1[1]
141195200 blocks [2/2] [UU]
[===================>.] check = 97.0% (136972928/141195200)
finish=39608.8min speed=1K/sec
md3 : active raid1 sdb3[0] sdd1[1]
141195200 blocks [2/2] [UU]
resync=DELAYED
md1 : active raid1 sda2[0] sdb2[1]
1951808 blocks [2/2] [UU]
resync=DELAYED
md0 : active raid1 sda1[0] sdb1[1]
489856 blocks [2/2] [UU]
unused devices: <none>
[02:15:15]coolcold@maindb:~$ ps -e -o cmd,state --sort state|head
CMD S
[pdflush] D
[md1_resync] D
[md2_resync] D
[md3_resync] D
/usr/bin/rsync -aH /banners D
/bin/bash /root/scripts/bac D
ls --color=auto -la D
ps -e -o cmd,state --sort s R
init [2] S
Array was in checking state, but speed was really strange - one day
i've already seen such low speed, but don't remember on resync or on
check and was machine the same or other, while kernel, most likely was
the same - all my production machines has the same kernel.
Referring to logs, array check was caused by check-array script -
debian has auto check on every first Sunday of the month at 1:06 AM
I've waited for sometime, but nothing changed, speed have not grown,
processes were still in "D", so i've done "echo b >
/proc/sysrq-trigger" to reboot it. After some time, ~ 20 minutes
machine came back, looks like it was syncing raid before bringing up
network, which is really strange for me, since i've thought resync
should go in background and not interfere with normal operations:
--- cut ---
Mar 1 02:50:06 maindb kernel: [ 6.396342] raid1: raid set md3
active with 2 out of 2 mirrors
Mar 1 02:50:06 maindb kernel: [ 5.154728] md: bind<sdc1>
Mar 1 02:50:06 maindb kernel: [ 6.431547] md: bind<sda3>
Mar 1 02:50:06 maindb kernel: [ 6.449480] raid1: raid set md2
active with 2 out of 2 mirrors
Mar 1 02:50:06 maindb kernel: [ 6.451157] md: resync of RAID array md2
Mar 1 02:50:06 maindb kernel: [ 6.451224] md: minimum _guaranteed_
speed: 1000 KB/sec/disk.
Mar 1 02:50:06 maindb kernel: [ 6.451294] md: using maximum
available idle IO bandwidth (but not more than 200000 KB/sec) for
resync.
Mar 1 02:50:06 maindb kernel: [ 6.451385] md: using 128k window,
over a total of 141195200 blocks.
Mar 1 02:50:06 maindb kernel: [ 7.053347] kjournald starting.
Commit interval 5 seconds
Mar 1 02:50:06 maindb kernel: [ 5.896644] EXT3 FS on md0, internal journal
Mar 1 02:50:06 maindb kernel: [ 5.896762] EXT3-fs: mounted
filesystem with ordered data mode.
Mar 1 02:50:06 maindb kernel: [ 7.077823] JFS: nTxBlock = 8192,
nTxLock = 65536
Mar 1 02:50:06 maindb kernel: [ 216.218519] md: md2: resync done.
Mar 1 02:50:06 maindb kernel: [ 221.486827] RAID1 conf printout:
Mar 1 02:50:06 maindb kernel: [ 221.486827] --- wd:2 rd:2
Mar 1 02:50:06 maindb kernel: [ 221.486827] disk 0, wo:0, o:1, dev:sda3
Mar 1 02:50:06 maindb kernel: [ 221.486827] disk 1, wo:0, o:1, dev:sdc1
Mar 1 02:50:06 maindb kernel: [ 218.568293] NET: Registered protocol family 10
Mar 1 02:50:06 maindb kernel: [ 218.570284] lo: Disabled Privacy Extensions
Mar 1 02:50:06 maindb kernel: [ 218.570925] ADDRCONF(NETDEV_UP):
eth0: link is not ready
Mar 1 02:50:06 maindb kernel: [ 218.571378] ADDRCONF(NETDEV_UP):
eth1: link is not ready
Mar 1 02:50:07 maindb kernel: [ 219.209950] eth1: Link is Up 1000
Mbps Full Duplex, Flow Control: None
---- end of cut ----
Now I'm trying to understand what the problem was/is, and I've found
Neil's Brown letter into lkml about fixed deadlocks (
http://lkml.org/lkml/2008/3/2/175 ) in 2.6.25-rc2 . Not sure this is
my case because:
1) my kernel is 2.6.25-2-amd64
[08:50:48]root@maindb:/var/
log# cat /proc/version
Linux version 2.6.25-2-amd64 (Debian 2.6.25-3) (maks@xxxxxxxxxx) (gcc
version 4.1.3 20080420 (prerelease) (Debian 4.1.2-22)) #1 SMP Wed May
14 14:04:05 UTC 2008
and patches should be already in, since appeared in rc2
2) you mention "Fix deadlock in md/raid1 and md/raid10 when handling a
read error", but I can't find any log entries about drive seek error
or such.
And I have no ideas how to reproduce it, except get semi-broken hdd
with predictable errors and try to play with read/resync
Could you please help me to clarify what's going on ? May be I've
found new bug... or just missing some hints in kernel log?
http://web.coolcold.org/screens/mdraid/cpu_usage_iowait.png - cpu is busy in IO
http://web.coolcold.org/screens/mdraid/sda_sda3_disk_traffic.png and
http://web.coolcold.org/screens/mdraid/sdc1_disk_traffic.png - data
reading on partitions in md2
--
Best regards,
[COOLCOLD-RIPN]
--
To unsubscribe from this list: send the line "unsubscribe linux-raid" in
the body of a message to majordomo@xxxxxxxxxxxxxxx
More majordomo info at http://vger.kernel.org/majordomo-info.html
