Hi DipanjanIf the connections are not being closed and left open , you should see 50,000 processes running on the server because postgresql creates/forks a new process for each connectionJust having that many processes running will exhaust resources, I would confirm that the process are still running.you can use the commandps aux |wc -lto get a count on the number of processesBeyond just opening the connection are there any actions such as Select * from sometable being fired off to measure performance?Attempting to open and leave 50K connections open should exhaust the server resources long before reaching 50KSomething is off here I would be looking into how this test actually works, how the connections are opened, and commands it sends to PostgresqlOn Tue, Feb 25, 2020 at 2:12 PM Dipanjan Ganguly <dipagnjan@xxxxxxxxx> wrote:Hi Justin,Thanks for your insight.I agree with you completely, but as mentioned in my previous email, the fact that Postgres server resource utilization is less "( Avg load 1, Highest Cpu utilization 26%, lowest freemem 9000)" and it recovers at a certain point then consistently reaches close to 50 k , is what confusing me..Legends from the Tsung report:users
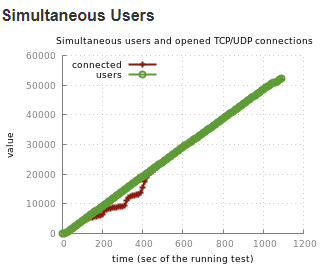
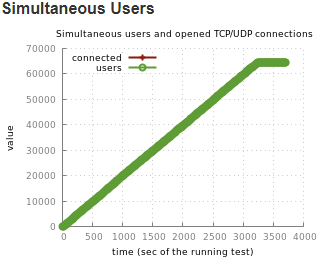
- Number of simultaneous users (it's session has started, but not yet finished).
- connected
- number of users with an opened TCP/UDP connection (example: for HTTP, during a think time, the TCP connection can be closed by the server, and it won't be reopened until the thinktime has expired)
- I have also used pgcluu to monitor the events. Sharing the stats below..
- Memory information
- 15.29 GB Total memory
- 8.79 GB Free memory
- 31.70 MB Buffers
- 5.63 GB Cached
- 953.12 MB Total swap
- 953.12 MB Free swap
- 13.30 MB Page Tables
- 3.19 GB Shared memory
Any thoughts ??!! 🤔🤔Thanks,DipanjanOn Tue, Feb 25, 2020 at 10:31 PM Justin <zzzzz.graf@xxxxxxxxx> wrote:Hi DipanjanPlease do not post to all the postgresql mailing list lets keep this on one list at a time, Keep this on general listAm i reading this correctly 10,000 to 50,000 open connections.Postgresql really is not meant to serve that many open connections.Due to design of Postgresql each client connection can use up to the work_mem of 256MB plus additional for parallel processes. Memory will be exhausted long before 50,0000 connections is reachedI'm not surprised Postgresql and the server is showing issues long before 10K connections is reached. The OS is probably throwing everything to the swap file and see connections dropped or time out.Should be using a connection pooler to service this kind of load so the Postgresql does not exhaust resources just from the open connections.
On Tue, Feb 25, 2020 at 11:29 AM Dipanjan Ganguly <dipagnjan@xxxxxxxxx> wrote:Greetings,
I was trying to use postgresql database as a backend with Ejabberd XMPP server for load test (Using TSUNG).
Noticed, while using Mnesia the “simultaneous users and open TCP/UDP connections” graph in Tsung report is showing consistency, but while using Postgres, we see drop in connections during 100 to 500 seconds of runtime, and then recovering and staying consistent.
I have been trying to figure out what the issue could be without any success. I am kind of a noob in this technology, and hoping for some help from the good people from the community to understand the problem and how to fix this. Below are some details..
· Postgres server utilization is low ( Avg load 1, Highest Cpu utilization 26%, lowest freemem 9000)
Tsung graph:
 Graph 1: Postgres 12 Backen
Graph 2: Mnesia backend
· Ejabberd Server: Ubuntu 16.04, 16 GB ram, 4 core CPU.
· Postgres on remote server: same config
· Errors encountered during the same time: error_connect_etimedout (same outcome for other 2 tests)
· Tsung Load: 512 Bytes message size, user arrival rate 50/s, 80k registered users.
· Postgres server utilization is low ( Avg load 1, Highest Cpu utilization 26%, lowest freemem 9000)
· Same tsung.xm and userlist used for the tests in Mnesia and Postgres.
Postgres Configuration used:
shared_buffers = 4GB
effective_cache_size = 12GB
maintenance_work_mem = 1GB
checkpoint_completion_target = 0.9
wal_buffers = 16MB
default_statistics_target = 100
random_page_cost = 4
effective_io_concurrency = 2
work_mem = 256MB
min_wal_size = 1GB
max_wal_size = 2GB
max_worker_processes = 4
max_parallel_workers_per_gather = 2
max_parallel_workers = 4
max_parallel_maintenance_workers = 2max_connections=50000
Kindly help understanding this behavior. Some advice on how to fix this will be a big help .
Thanks,
Dipanjan
Hi Justin,
I have already checked running Postgres processes and strangely never counted more than 20.
I'll check as you recommend on how ejabberd to postgresql connectivity works. May be the answer lies there. Will get back if I find something.
Thanks for giving some direction to my thoughts.
Good talk. 👍👍
BR,
Dipanjan
On Wed 26 Feb, 2020 1:05 am Justin, <zzzzz.graf@xxxxxxxxx> wrote:

