We recently upgrade the ceph-mgr to 15.2.4, Octopus in our production clusters. The status of the cluster now is as follow:
# ceph versions
{
"mon": {
"ceph version 15.2.4 (7447c15c6ff58d7fce91843b705a268a1917325c) octopus (stable)": 5
},
"mgr": {
"ceph version 15.2.4 (7447c15c6ff58d7fce91843b705a268a1917325c) octopus (stable)": 3
},
"osd": {
"ceph version 15.2.4 (7447c15c6ff58d7fce91843b705a268a1917325c) octopus (stable)": 1933
},
"mds": {
"ceph version 15.2.4 (7447c15c6ff58d7fce91843b705a268a1917325c) octopus (stable)": 14
},
"overall": {
"ceph version 15.2.4 (7447c15c6ff58d7fce91843b705a268a1917325c) octopus (stable)": 1955
}
}
Now we suffered some problems in this cluster:
1. it always took a significant longer time to get the result of `ceph pg dump`.
2. the ceph-exportor might failed to get cluster metrics.
3. sometimes the cluster showed a few inactive/down pgs but recovered very soon.
We did a investigation on the ceph-mgr, didn't get the root cause yet. But there are some dispersed clews (I am not sure if they ca help):
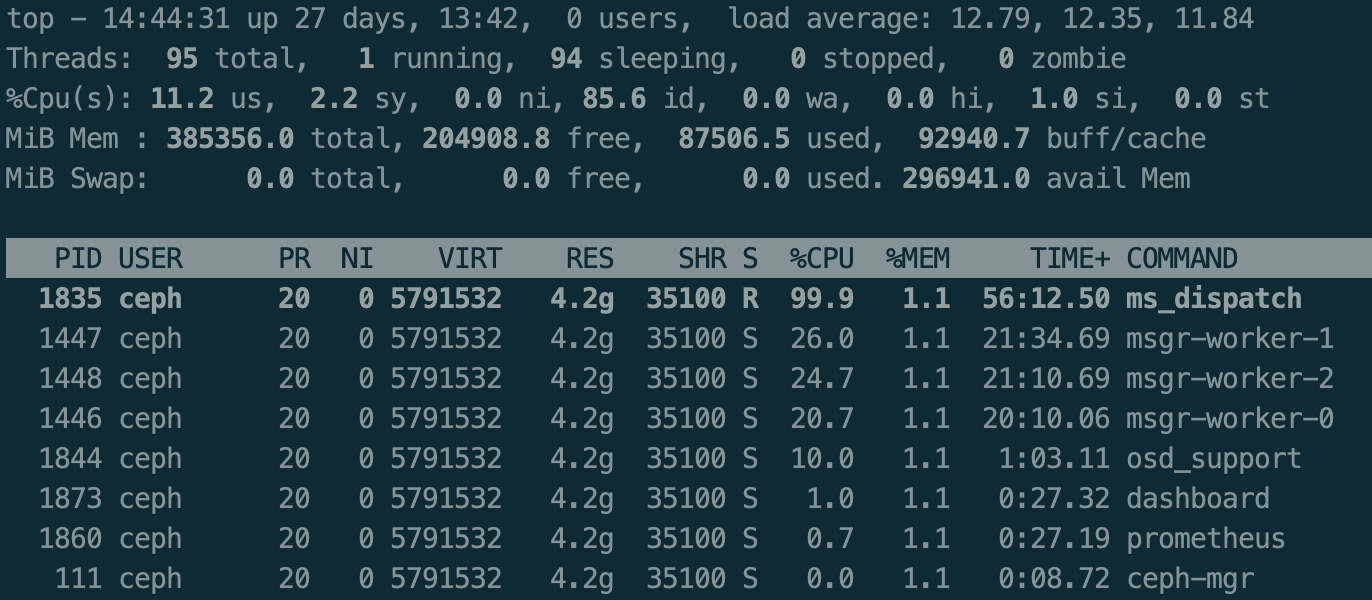
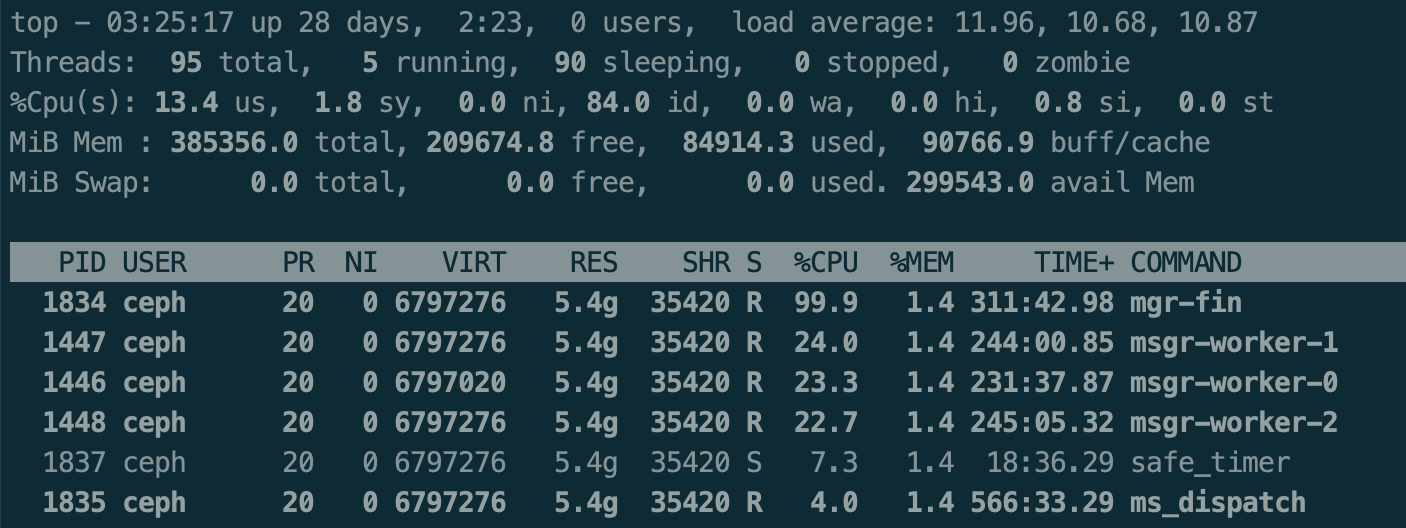
1. the ms_dispatch thread is always busy with one core.

2. the msg size is significant larger than 40K.
2020-09-24T14:47:50.216+0000 7f8f811f6700 1 -- [v2:{mgr_ip}:6800/111,v1:{mgr_ip}:6801/111] <== osd.3038 v2:{osd_ip}:6800/384927 431 ==== pg_stats(17 pgs tid 0 v 0) v2 ==== 42153+0+0 (secure 0 0 0) 0x55dae07c1800 con 0x55daf6dde400
3. get some errors of "Fail to parse JSON result".
2020-09-24T15:47:42.739+0000 7f8f8da0f700 0 [devicehealth ERROR root] Fail to parse JSON result from daemon osd.1292 ()
4. in the sending channel, we could see lots of faults.
2020-09-24T14:53:17.725+0000 7f8fa866e700 1 -- [v2:{mgr_ip}:6800/111,v1:{mgr_ip}:6801/111] >> v1:{osd_ip}:0/1442957044 conn(0x55db38757400 legacy=0x55db03d8e800 unknown :6801 s=STATE_CONNECTION_ESTABLISHED l=1).tick idle (909347879) for more than 900000000 us, fault.
2020-09-24T14:53:17.725+0000 7f8fa866e700 1 --1- [v2:{mgr_ip}:6800/111,v1:{mgr_ip}:6801/111] >> v1:{osd_ip}:0/1442957044 conn(0x55db38757400 0x55db03d8e800 :6801 s=OPENED pgs=1572189 cs=1 l=1).fault on lossy channel, failing

"queue_len": 1359862,
"complete_latency": {
"avgcount": 14,
"sum": 40300.307764855,
"avgtime": 2878.593411775
}
},
Sorry about these clews are a little messy. Could you have any comments on this?
Thanks.
Regards,
Hao
_______________________________________________
Dev mailing list -- dev@xxxxxxx
To unsubscribe send an email to dev-leave@xxxxxxx
