Andras


On 09/05/2018 10:15 AM, Andras Pataki wrote:
Below are the performance counters. Some scientific workflows trigger this - some parts of them are quite data intensive - they process thousands of files over many hours to days. The 200GB ceph-fuse got there in about 3 days. I'm keeping the node alive for now in case we can extract some more definitive info on what is happening there.Andras # ceph daemon /var/run/ceph/ceph-client.admin.asok perf dump { "AsyncMessenger::Worker-0": { "msgr_recv_messages": 37730, "msgr_send_messages": 37731, "msgr_recv_bytes": 1121379127, "msgr_send_bytes": 11913693154, "msgr_created_connections": 75333, "msgr_active_connections": 730, "msgr_running_total_time": 642.152166956, "msgr_running_send_time": 536.723862752, "msgr_running_recv_time": 25.429112242, "msgr_running_fast_dispatch_time": 63.814291954 }, "AsyncMessenger::Worker-1": { "msgr_recv_messages": 38507, "msgr_send_messages": 38467, "msgr_recv_bytes": 1240174043, "msgr_send_bytes": 11673685736, "msgr_created_connections": 75479, "msgr_active_connections": 729, "msgr_running_total_time": 628.670562086, "msgr_running_send_time": 523.772820969, "msgr_running_recv_time": 25.902871268, "msgr_running_fast_dispatch_time": 62.375965165 }, "AsyncMessenger::Worker-2": { "msgr_recv_messages": 597697, "msgr_send_messages": 504640, "msgr_recv_bytes": 1314713236, "msgr_send_bytes": 11880445442, "msgr_created_connections": 75338, "msgr_active_connections": 728, "msgr_running_total_time": 711.909282325, "msgr_running_send_time": 556.195748166, "msgr_running_recv_time": 127.267332682, "msgr_running_fast_dispatch_time": 62.209721085 }, "client": { "reply": { "avgcount": 236795, "sum": 6177.205536940, "avgtime": 0.026086722 }, "lat": { "avgcount": 236795, "sum": 6177.205536940, "avgtime": 0.026086722 }, "wrlat": { "avgcount": 857828153, "sum": 8413.835066735, "avgtime": 0.000009808 } }, "objectcacher-libcephfs": { "cache_ops_hit": 4160412, "cache_ops_miss": 4887, "cache_bytes_hit": 3247294145494, "cache_bytes_miss": 12914144260, "data_read": 48923557765, "data_written": 35292875783, "data_flushed": 35292681606, "data_overwritten_while_flushing": 0, "write_ops_blocked": 0, "write_bytes_blocked": 0, "write_time_blocked": 0.000000000 }, "objecter": { "op_active": 0, "op_laggy": 0, "op_send": 111268, "op_send_bytes": 35292681606, "op_resend": 0, "op_reply": 111268, "op": 111268, "op_r": 2193, "op_w": 109075, "op_rmw": 0, "op_pg": 0, "osdop_stat": 2, "osdop_create": 2, "osdop_read": 2193, "osdop_write": 109071, "osdop_writefull": 0, "osdop_writesame": 0, "osdop_append": 0, "osdop_zero": 0, "osdop_truncate": 0, "osdop_delete": 0, "osdop_mapext": 0, "osdop_sparse_read": 0, "osdop_clonerange": 0, "osdop_getxattr": 0, "osdop_setxattr": 0, "osdop_cmpxattr": 0, "osdop_rmxattr": 0, "osdop_resetxattrs": 0, "osdop_tmap_up": 0, "osdop_tmap_put": 0, "osdop_tmap_get": 0, "osdop_call": 0, "osdop_watch": 0, "osdop_notify": 0, "osdop_src_cmpxattr": 0, "osdop_pgls": 0, "osdop_pgls_filter": 0, "osdop_other": 0, "linger_active": 0, "linger_send": 0, "linger_resend": 0, "linger_ping": 0, "poolop_active": 0, "poolop_send": 0, "poolop_resend": 0, "poolstat_active": 0, "poolstat_send": 0, "poolstat_resend": 0, "statfs_active": 0, "statfs_send": 1348, "statfs_resend": 0, "command_active": 0, "command_send": 0, "command_resend": 0, "map_epoch": 1079783, "map_full": 0, "map_inc": 632, "osd_sessions": 2160, "osd_session_open": 226144, "osd_session_close": 223984, "osd_laggy": 0, "omap_wr": 0, "omap_rd": 0, "omap_del": 0 }, "throttle-msgr_dispatch_throttler-client": { "val": 0, "max": 104857600, "get_started": 0, "get": 673934, "get_sum": 3626395290, "get_or_fail_fail": 0, "get_or_fail_success": 673934, "take": 0, "take_sum": 0, "put": 673934, "put_sum": 3626395290, "wait": { "avgcount": 0, "sum": 0.000000000, "avgtime": 0.000000000 } }, "throttle-objecter_bytes": { "val": 0, "max": 104857600, "get_started": 0, "get": 0, "get_sum": 0, "get_or_fail_fail": 0, "get_or_fail_success": 0, "take": 111268, "take_sum": 38456168409, "put": 111264, "put_sum": 38456168409, "wait": { "avgcount": 0, "sum": 0.000000000, "avgtime": 0.000000000 } }, "throttle-objecter_ops": { "val": 0, "max": 1024, "get_started": 0, "get": 0, "get_sum": 0, "get_or_fail_fail": 0, "get_or_fail_success": 0, "take": 111268, "take_sum": 111268, "put": 111268, "put_sum": 111268, "wait": { "avgcount": 0, "sum": 0.000000000, "avgtime": 0.000000000 } } } On 09/05/2018 10:00 AM, Sage Weil wrote:On Wed, 5 Sep 2018, Andras Pataki wrote:Hi cephers,Every so often we have a ceph-fuse process that grows to rather large size (up to eating up the whole memory of the machine). Here is an example of a 200GBRSS size ceph-fuse instance: # ceph daemon /var/run/ceph/ceph-client.admin.asok dump_mempools { "bloom_filter": { "items": 0, "bytes": 0 }, "bluestore_alloc": { "items": 0, "bytes": 0 }, "bluestore_cache_data": { "items": 0, "bytes": 0 }, "bluestore_cache_onode": { "items": 0, "bytes": 0 }, "bluestore_cache_other": { "items": 0, "bytes": 0 }, "bluestore_fsck": { "items": 0, "bytes": 0 }, "bluestore_txc": { "items": 0, "bytes": 0 }, "bluestore_writing_deferred": { "items": 0, "bytes": 0 }, "bluestore_writing": { "items": 0, "bytes": 0 }, "bluefs": { "items": 0, "bytes": 0 }, "buffer_anon": { "items": 51534897, "bytes": 207321872398 }, "buffer_meta": { "items": 64, "bytes": 5632 }, "osd": { "items": 0, "bytes": 0 }, "osd_mapbl": { "items": 0, "bytes": 0 }, "osd_pglog": { "items": 0, "bytes": 0 }, "osdmap": { "items": 28593, "bytes": 431872 }, "osdmap_mapping": { "items": 0, "bytes": 0 }, "pgmap": { "items": 0, "bytes": 0 }, "mds_co": { "items": 0, "bytes": 0 }, "unittest_1": { "items": 0, "bytes": 0 }, "unittest_2": { "items": 0, "bytes": 0 }, "total": { "items": 51563554, "bytes": 207322309902 } }The general cache size looks like this (if it is helpful I can put a wholecache dump somewhere):# ceph daemon /var/run/ceph/ceph-client.admin.asok dump_cache | grep path | wc-l 84085# ceph daemon /var/run/ceph/ceph-client.admin.asok dump_cache | grep name | wc-l 168186Any ideas what 'buffer_anon' is and what could be eating up the 200GB ofRAM?buffer_anon is memory consumed by the bufferlist class that hasn't been explicitly put into a separate mempool category. The question is where/why are buffers getting pinned in memory. Can you dump the perfcounters? That might give some hint. My guess is a leak, or a problem with the ObjectCacher code that is preventing it from timming older buffers. How reproducible is the situation? Any idea what workloads trigger it? Thanks! sageWe are running with a few ceph-fuse specific parameters increased in ceph.conf: # Description: Set the number of inodes that the client keeps in the metadata cache. # Default: 16384 client_cache_size = 262144 # Description: Set the maximum number of dirty bytes in the object cache. # Default: 104857600 (100MB) client_oc_max_dirty = 536870912# Description: Set the maximum number of objects in the object cache.# Default: 1000 client_oc_max_objects = 8192 # Description: Set how many bytes of data will the client cache. # Default: 209715200 (200 MB) client_oc_size = 2147483640 # Description: Set the maximum number of bytes that the kernel reads ahead for future read operations. Overridden by the client_readahead_max_periods setting. # Default: 0 (unlimited) #client_readahead_max_bytes = 67108864# Description: Set the number of file layout periods (object size *number of stripes) that the kernel reads ahead. Overrides the client_readahead_max_bytes setting. # Default: 4 client_readahead_max_periods = 64 # Description: Set the minimum number bytes that the kernel reads ahead. # Default: 131072 (128KB) client_readahead_min = 4194304We are running a 12.2.7 ceph cluster, and the cluster is otherwise healthy.Any hints would be appreciated. Thanks, Andras
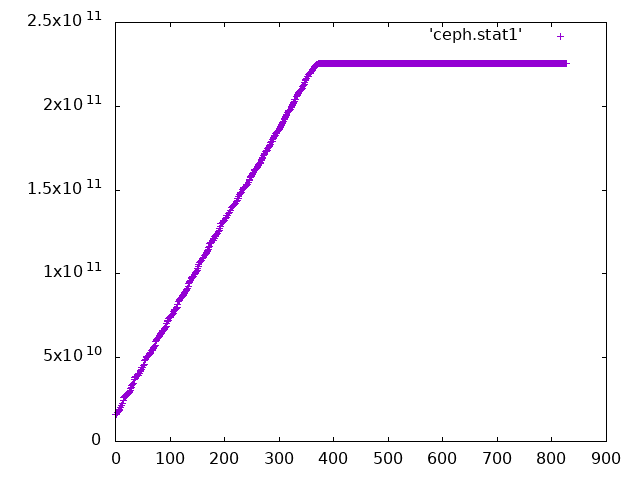
Attachment:
ceph-fuse-mem.png
Description: PNG image
_______________________________________________
ceph-users mailing list
ceph-users@xxxxxxxxxxxxxx
http://lists.ceph.com/listinfo.cgi/ceph-users-ceph.com
