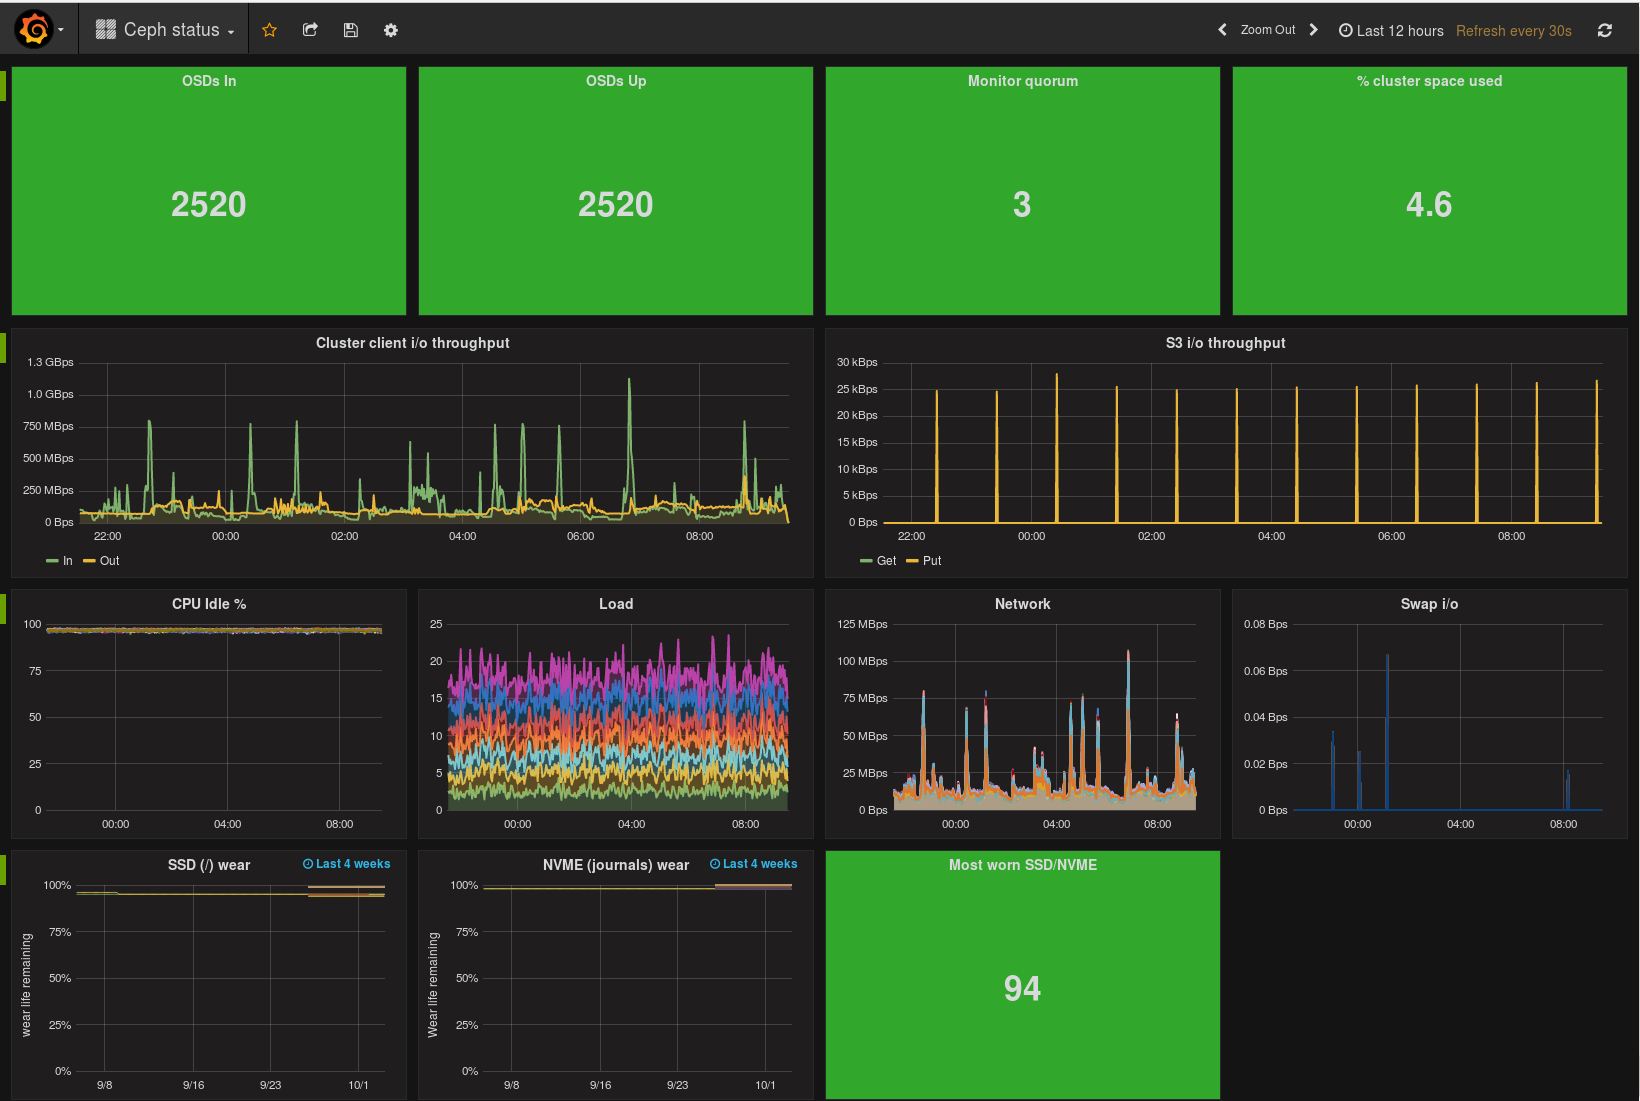
On 02/10/17 20:26, Erik McCormick wrote:
> On Mon, Oct 2, 2017 at 11:55 AM, Matthew Vernon <mv3@xxxxxxxxxxxx> wrote:
>> Making a dashboard is rather a matter of personal preference - we plot
>> client and s3 i/o, network, server load & CPU use, and have indicator
>> plots for numbers of osds up&in, and monitor quorum.
>>
>> [I could share our dashboard JSON, but it's obviously specific to our
>> data sources]
>
> I for one would love to see your dashboard. host and data source names
> can be easily replaced :)

OK. A screenshot is:
https://cog.sanger.ac.uk/ceph_dashboard/screenshot.png

(which should be self-explanatory - that's rather the point :) )

The json that builds it is:
https://cog.sanger.ac.uk/ceph_dashboard/dashboard.json

(you'd want to change the data source and hostnames to suit your own
install; sto-1-1 is one of our mon nodes).

HTH,

Matthew


--
 The Wellcome Trust Sanger Institute is operated by Genome Research
 Limited, a charity registered in England with number 1021457 and a
 company registered in England with number 2742969, whose registered
 office is 215 Euston Road, London, NW1 2BE.
_______________________________________________
ceph-users mailing list
ceph-users@xxxxxxxxxxxxxx
http://lists.ceph.com/listinfo.cgi/ceph-users-ceph.com
 |