|
Are you using SSD journal ? I would say try tuning with the following parameters first.. journal_max_write_entries
journal_max_write_bytes
journal_queue_max_ops
journal_queue_max_bytes
filestore_max_sync_interval
filestore_min_sync_interval
filestore_wbthrottle_enable //Use only if WBRhrottle enable..Start filestore_wbthrottle_xfs_bytes_start_flusher filestore_wbthrottle_xfs_bytes_hard_limit filestore_wbthrottle_xfs_ios_start_flusher filestore_wbthrottle_xfs_ios_hard_limit
filestore_wbthrottle_xfs_inodes_start_flusher ////Use only if WBRhrottle enable..End filestore_queue_max_ops
filestore_queue_max_bytes //Use if btrfs filestore_queue_committing_max_ops filestore_queue_committing_max_bytes Also, try some of the vm tunables like the following vm.dirty_ratio vm.dirty_background_ratio vm.dirty_expire_centisecs vm.swappiness Thanks & Regards Somnath From: Ray Sun [mailto:xiaoquqi@xxxxxxxxx]
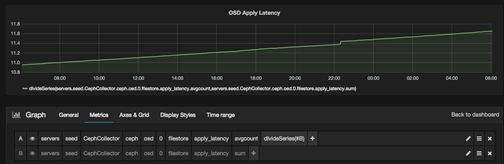
Roy, I try to use Grafana to make a trend image of apply_latency of my osd 0, and it seems grow all the time. So as my understanding, both of the keys(avgcount, sum) is accumulation values. So the
correct arithmetic should be: current apply latency = (avgcount current - avgcount previous)/(sum current - sum previous) Currently, I try to tuning and monitor Ceph cluster using this values, what's the best values I should pay attention to in your opinion. Is "ceph osd perf" including all the important performance values of Ceph clusters? Is there any other commands I should also use to get the performance values? Thanks.
Best Regards On Mon, Jul 6, 2015 at 5:56 AM, Somnath Roy <Somnath.Roy@xxxxxxxxxxx> wrote: Yes, similar values are reported in ‘ceph osd perf’..But, here the commit_latency meaning the journal
commit latency in admin socket perf dump.. Also, remember, these values (latencies) are not stable (that’s why you will be seeing spiky write
performance) and very difficult to correlate I guess..But, you should have a fair idea where most of the time spent in the filestore backend.. Thanks & Regards Somnath From: Ray Sun [mailto:xiaoquqi@xxxxxxxxx]
Roy, This is really helpful. So as your description, for each ops/seconds, I can use avgcount/sum. Is this the same value as "ceph osd
perf"? osd fs_commit_latency(ms) fs_apply_latency(ms) 0 23 85 1 2 2 2 32 36
Best Regards On Mon, Jul 6, 2015 at 2:23 AM, Somnath Roy <Somnath.Roy@xxxxxxxxxxx> wrote: Hi Ray, Here is the description of the different latencies under filestore perf counters. Journal_latency : ---------------------- This is the latency of putting the ops in journal. Write is acknowledged after that (well a bit after
that, there is one context switch after this). commitcycle_latency: -------------------------- Filestore backend while carrying out transaction, do a buffered write. In a separate thread it does
call syncfs() to persist the data to the disk and update the persistent commit number in a separate file. This thread runs by default 5 sec interval. This latency measures the time taken to carry out this job after the timer expires i.e the actual
persisting cycle. apply_latency: ---------------- This is the entire latency till the transaction finishes i.e journal write + transaction time. It
will do a buffer write here. queue_transaction_latency_avg: ---------------------------------------- This is the latency of putting the op in the journal queue. This will give you an idea how much throttling
is going on at the first place. This depends on the following two parameters if you are using XFS. filestore_queue_max_ops filestore_queue_max_bytes All the latency numbers are represented by avgcount(number of ops within this range) and the sum
(which is total latency in second). Sum/avgcount will give you an idea the latency per op. Hope this is helpful, Thanks & Regards Somnath From: ceph-users [mailto:ceph-users-bounces@xxxxxxxxxxxxxx]
On Behalf Of Ray Sun Cephers, Is there any documents or code definition to explain ceph perf dump? I am a little confusing about the output, for example, under
filestore, there's journal_latency and apply_latency and each of them has avgcount and sum. I am not quite sure what's the unit and meaning of the numbers? How can I use these numbers to tuning my ceph cluster. Thanks a lot. "filestore": { "journal_queue_max_ops": 300, "journal_queue_ops": 0, "journal_ops": 35893, "journal_queue_max_bytes": 33554432, "journal_queue_bytes": 0, "journal_bytes": 20579009432, "journal_latency": { "avgcount": 35893, "sum": 1213.560761279 }, "journal_wr": 34228, "journal_wr_bytes": { "avgcount": 34228, "sum": 20657713152 }, "journal_full": 0, "committing": 0, "commitcycle": 3207, "commitcycle_interval": { "avgcount": 3207, "sum": 16157.379852152 }, "commitcycle_latency": { "avgcount": 3207, "sum": 121.892109010 }, "op_queue_max_ops": 50, "op_queue_ops": 0, "ops": 35893, "op_queue_max_bytes": 104857600, "op_queue_bytes": 0, "bytes": 20578506930, "apply_latency": { "avgcount": 35893, "sum": 1327.974596287 }, "queue_transaction_latency_avg": { "avgcount": 35893, "sum": 0.025993727 } }, Best Regards
|
_______________________________________________
ceph-users mailing list
ceph-users@xxxxxxxxxxxxxx
http://lists.ceph.com/listinfo.cgi/ceph-users-ceph.com
