On 2/3/14 14:34 , Craig Lewis wrote:
On 2/3/14 10:51 , Gregory Farnum wrote:
On Mon, Feb 3, 2014 at 10:43 AM, Craig Lewis <clewis@xxxxxxxxxxxxxxxxxx> wrote:
I've been noticing somethings strange with my RGW federation.  I added some
statistics to radosgw-agent to try and get some insight
(https://github.com/ceph/radosgw-agent/pull/7), but that just showed me that
I don't understand how replication works.

When PUT traffic was relatively slow to the master zone, replication had no
issues keeping up.  Now I'm trying to cause replication to fall behind, by
deliberately exceeding the amount of bandwidth between the two zones
(they're in different datacenters).  Instead of falling behind, both the
radosgw-agent logs and the stats I added say that slave zone is keeping up.

But some of the numbers don't add up.  I'm not using enough bandwidth
between the two facilities, and I'm not using enough disk space in the slave
zone.  The disk usage in the slave zone continues to fall further and
further behind the master.  Despite this, I'm always able to download
objects from both zones.


How does radosgw-agent actually replicate metadata and data?  Does
radosgw-agent actually copy all the bytes, or does it create placeholders in
the slave zone?  If radosgw-agent is creating placeholders in the slave
zone, and radosgw populates the placeholder in the background, then that
would explain the behavior I'm seeing.  If this is true, how can I tell if
replication is keeping up?
Are you overwriting the same objects? Replication copies over the
"present" version of an object, not all the versions which have ever
existed. Similarly, the slave zone doesn't keep all the
(garbage-collected) logs that the master zone has to, so those factors
would be one way to get differing disk counts.
-Greg
Software Engineer #42 @ http://inktank.com | http://ceph.com
Before I started this import, the master zone was using 3.54TB
(raw), and the slave zone was using 3.42 TB (raw). I did
overwrite some objects, and the 120GB is plausible for overwrites.
I haven't deleted anything yet, so the only garbage collection
would be overwritten objects. Right?
I imported 1.93TB of data. Replication is currently 2x, so that's
3.86TB (raw). Now the master is using 7.48TB (raw), and the slave
is using 4.89TB (raw). The master zone looks correct, but the
slave zone is missing 2.59TB (raw). That's 66% of my imported
data.
The 33% of data the slave does have is in line with the amount of
bandwidth I see between the two facilities. I see an increase of
~150 Mbps when the import is running on the master, and ~50 Mbps
on the slave.
Just to verify that I'm not over writing objects, I checked the
apache logs. Since I started the import, there have been 1328542
PUTs (including normal site traffic). 1301511 of those are
unique. I'll investigate the 27031 duplicates, but the dups are
only 34GB. Not nearly enough to account for the discrepancy.
From your answer, I'll assume there are no placeholders involved.
If radosgw-agent says we're up to date, the data should exist in
the slave zone.
Now I'm really confused.
Craig Lewis
Senior Systems Engineer
Office +1.714.602.1309
Email clewis@xxxxxxxxxxxxxxxxxx
Central Desktop. Work
together in ways you never thought possible.
Connect with us Website | Twitter | Facebook | LinkedIn | Blog
_______________________________________________
ceph-users mailing list
ceph-users@xxxxxxxxxxxxxx
http://lists.ceph.com/listinfo.cgi/ceph-users-ceph.com
Here's another example. At 23:40 PST, radosgw-agent stalled. This
is something that's been happening, but I haven't dug into it yet.
Ignore that for now. The point is that replication now has a
backlog of 106000 PUTs requests, roughly 125GB.
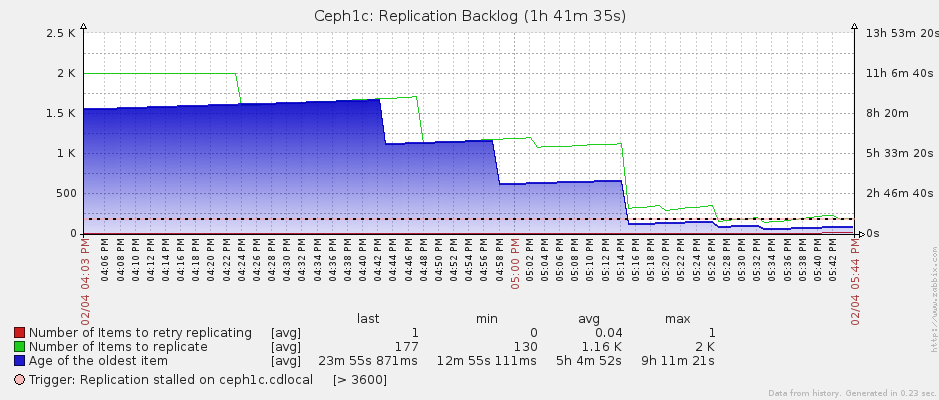
A graph using the --stats patch I submitted to radosgw-agent:

X axis is time in UTC.
Left axises is (to use pseudo code) sum( length(
DataSyncer.get_log_enteries( *allshards))). This is the scale for
the green line.
The right axis is the delta between now and the oldest entry's
timestamp from all shards. This is the scale for the blue area.
I only have 2 buckets that are actively being written to.
Replication entries cap at 1000 entries per shard, so that's why the
green line levels off at 2000.
I restarted replication at 08:15 PDT:
Both this graph and the radosgw-agent logs say that it took about
1h15m to catch up. If true, that would require a transfer rate
(uncompressed) of about 225 Mbps. My inter-datacenter bandwidth
graphs show a peak of 50 Mbps, and an average of 20 Mbps. This link
is capped at 100 Mbps.
During the 8h30m that replication was stalled, the master zone's
raw cluster storage went from 7.99TB to 8.34TB. The import accounts
for 250GB of that 350GB, the remaining 100GB is site traffic.
During the stall, the slave's raw cluster storage was steady at
5.07TB. After the replication restart, the slave's cluster storage
went from 5.07TB to 5.09TB. This 20 GB increase is consistent with
the amount of inter-datacenter bandwidth used (20 Mbps * 1h15m =
10GB transferred).
I'm going to stop replication, and verify checksums on those 106000
objects in the slave. I've been spot checking, but I've never
validated all of the objects.
--
Craig Lewis
|
