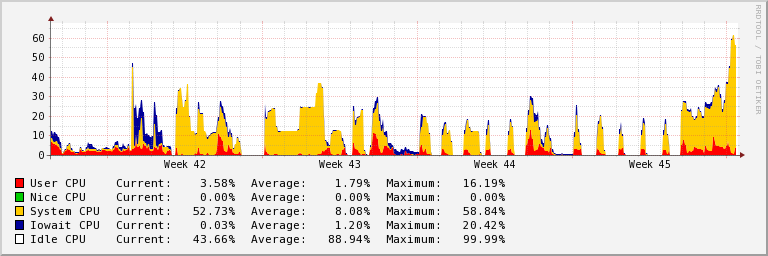
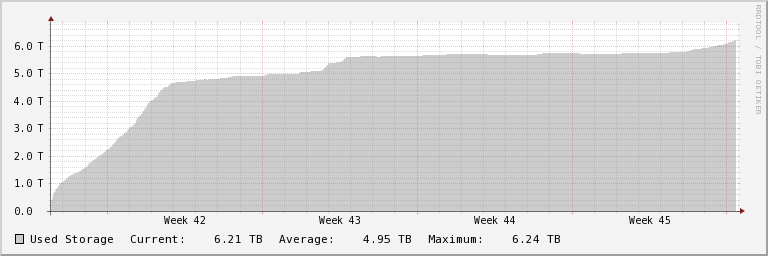
Hello,

we have 30 backup servers with 20TB backup partition each.
While server is new and empty rsync is compying data prety fast, but
when it reaches about 4.5TB write operation become very slow (about 10
times slower).

I have attached cpu and disk graphs.

As you can see first week, while server was empty, rsync was using "user"
cpu and data copying was fast. Later rsync started to use "system" cpu
and data copying became much slower. Same situation is on all our backup
servers. Before we had used smaller partition with ext4 and we had no
problems.

Most time rsync is spending on ftruncate:

% time     seconds  usecs/call     calls    errors syscall
------ ----------- ----------- --------- --------- ----------------
 99.99   18.362863      165431       111           ftruncate
  0.00    0.000712           3       224       112 open
  0.00    0.000195           1       257           write
  0.00    0.000171           1       250           read
  0.00    0.000075           1       112           lchown
  0.00    0.000039           0       112           lstat
  0.00    0.000028           0       112           close
  0.00    0.000021           0       112           chmod
  0.00    0.000011           0       396           select
  0.00    0.000000           0       112           utimes
------ ----------- ----------- --------- --------- ----------------
100.00   18.364115                  1798       112 total


I have checked disk fragmentation, but its not big:

xfs_db -c frag -r /dev/sda5
actual 80838233, ideal 80234908, fragmentation factor 0.75%

Here is some info from xfs_io statfs:

fd.path = "/var"
statfs.f_bsize = 4096
statfs.f_blocks = 5368112145
statfs.f_bavail = 3414301671
statfs.f_files = 4294907072
statfs.f_ffree = 4204584125
geom.bsize = 4096
geom.agcount = 20
geom.agblocks = 268435455
geom.datablocks = 5368633873
geom.rtblocks = 0
geom.rtextents = 0
geom.rtextsize = 1
geom.sunit = 0
geom.swidth = 0
counts.freedata = 3414301671
counts.freertx = 0
counts.freeino = 61
counts.allocino = 90323008

Partition table:

Filesystem            Size  Used Avail Use% Mounted on
/dev/sda3            1008M  225M  733M  24% /
/dev/sda1             124M   26M   92M  22% /boot
/dev/sda4             4.0G  522M  3.3G  14% /usr
/dev/sda5              20T  7.3T   13T  37% /var

Inodes:

Filesystem            Inodes   IUsed   IFree IUse% Mounted on
/dev/sda3              65536    4974   60562    8% /
/dev/sda1              32768      38   32730    1% /boot
/dev/sda4             262144   15586  246558    6% /usr


Any idea what could be a reason?
Let me know if any other info is needed.

Thanks
Linas
Attachment:
graph_cpu.png
Description: PNG image
Attachment:
graph_disk.png
Description: PNG image
_______________________________________________
xfs mailing list
xfs@xxxxxxxxxxx
http://oss.sgi.com/mailman/listinfo/xfs
