Bruce Momjian wrote:
> Magnus Hagander wrote:
>> Bruce Momjian wrote:
>>> Ron Mayer wrote:
>>>> Joshua D. Drake wrote:
>>>>> On Fri, 2008-11-21 at 08:18 -0800, Ron Mayer wrote:
>>>>>> Bruce Momjian wrote:
>>>>>>> Tom Lane wrote:
>>>>>>>> ... harder to keep
>>>>>>>> up with the list traffic; so something is happening that a simple
>>>>>>>> volume count doesn't capture.
>>>>>> If measured in "bytes of the gzipped mbox" it ...
>>>>> Its because we eliminated the -patches mailing list.
>>>> That's part of it.  I've added -patches to the graph at
>>>> http://0ape.com/postgres_mailinglist_size/ as well as
>>>> a graph of hackers+patches combined; and it still looks
>>>> like hackers+patches is quite high in the past 3 months.
>>>>
>>>> With hackers+patches it looks like 2002-08 was the biggest
>>>> month; but the past 3 months still look roughly twice
>>>> late 2007's numbers.
>>> Can someoone graph CVS traffic, showing the historical number of commits
>>> and number of changed lines?
>> Ohloh has some graphs, are they detailed enough?
>> http://www.ohloh.net/projects/postgres/analyses/latest
>
> I saw that but that only shows total lines, not the number of lines
> changed, or commits per hour, etc.

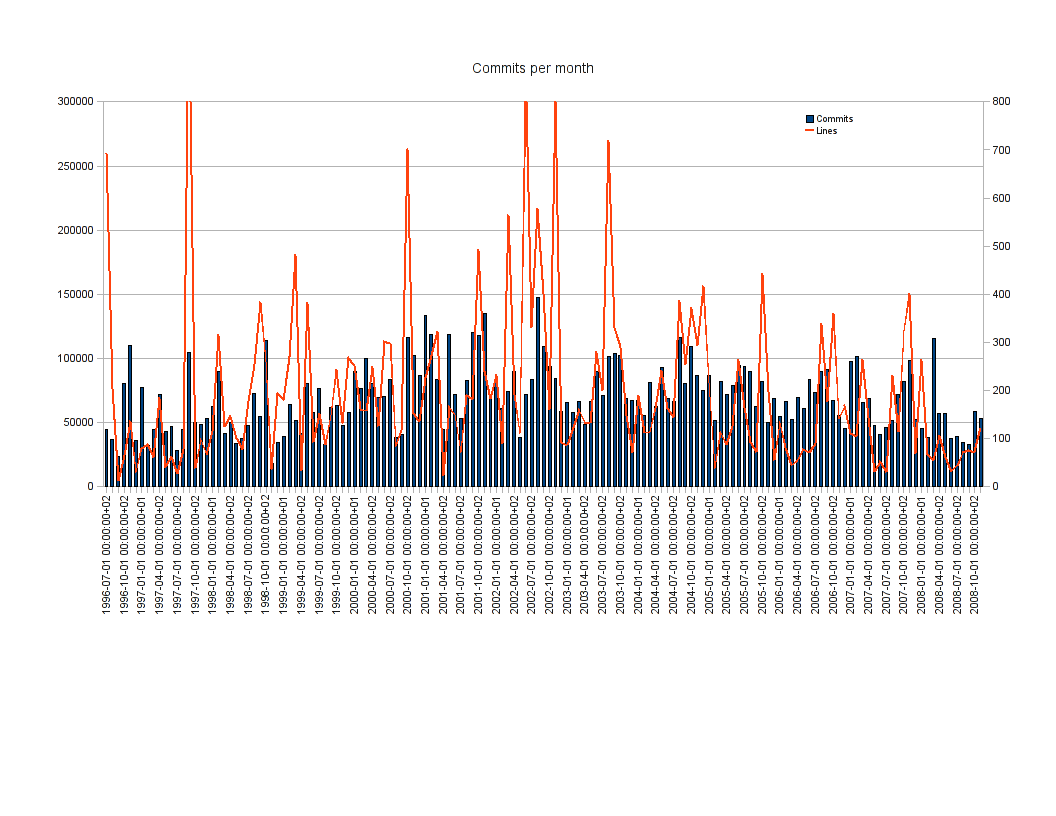
I've got a database of all our commits with info like: timestamp,
author, number of rows added/deleted, number of files modified, which
files modified, rows modified in each file. Basically it's data quickly
parsed from a "git log --stat" of HEAD (because it was a whole lot
easier to parse the git stuff). It's got about 27,500 commits in it -
only the stuff that happened on HEAD, nothing for backbranches.

So, if you can be a bit more specific in what you want :) Attached is
for example "commits per month" and "lines per month".

//Magnus
--
Sent via pgsql-general mailing list (pgsql-general@xxxxxxxxxxxxxx)
To make changes to your subscription:
http://www.postgresql.org/mailpref/pgsql-general

