Just trying to show that the query output is exactly the same anytime I run.
Thanks.
On Fri, Dec 30, 2022 at 3:24 PM Ron <ronljohnsonjr@xxxxxxxxx> wrote:
The screen shots are hard to see. Too small. (Imgur links might be better.)
On 12/30/22 10:04, Rushikesh socha wrote:
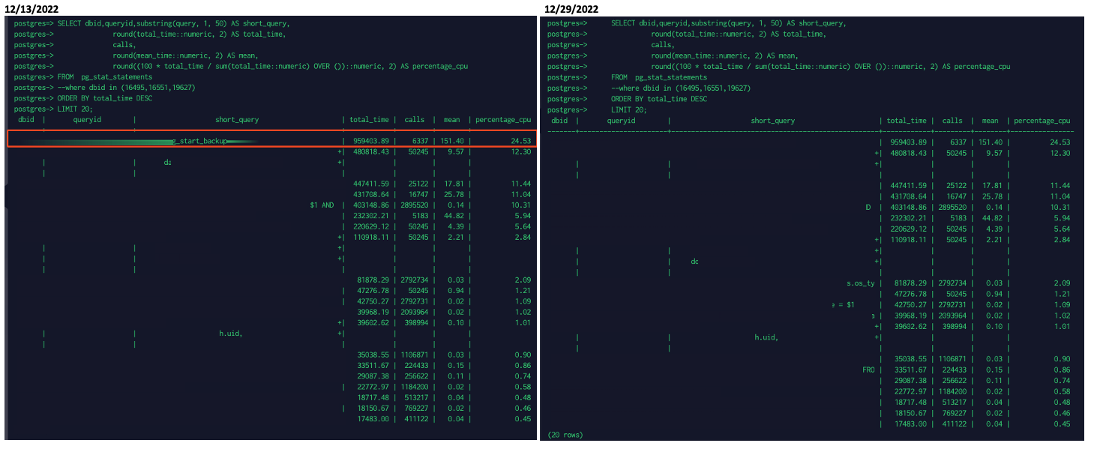
Hi, Whenever I am running the below query on one of my Azure PostgreSQL PaaS instances I am getting exact same output. I feel it shows old information but as far as i know pg_stat_statements only shows current information and not past right ? It may be a bug?
SELECT dbid,queryid,substring(query, 1, 50) AS short_query,
round(total_time::numeric, 2) AS total_time,
calls,
round(mean_time::numeric, 2) AS mean,
round((100 * total_time / sum(total_time::numeric) OVER ())::numeric, 2) AS percentage_cpu
FROM pg_stat_statements
ORDER BY total_time DESC
LIMIT 20;
I have erased the query text from the screenshot below. but Please look at the rest of the columns which are exactly the same. How it is possible ?
Thanks.
--
Born in Arizona, moved to Babylonia.