On Mon, Jul 22, 2019 at 11:28 AM Jehan-Guillaume (ioguix) de Rorthais <ioguix@xxxxxxx> wrote:
Hi,
On Mon, 22 Jul 2019 11:05:57 +0200
Tiemen Ruiten <t.ruiten@xxxxxxxxxxx> wrote:
[...]
> > Now to my current issue: I took the advice to add more monitoring on
> > replay lag (using pg_last_xact_replay_timestamp) and things are not looking
> > good. Last night replication lagged by almost 6 hours on one of the
> > nodes[3], but eventually caught up. As you can see in that screenshot,
> > ph-sql-03 is consistently slower to replay than ph-sql-05 (ph-sql-04 is the
> > current master) and there happen to be different SSD's in ph-sql-03
> > (Crucial MX300 vs Crucial MX500 in the other two), which makes me think
> > this is IO related.
Such a difference is quite surprising. Moreover, I suppose you have some
caching in front of disks (either RAID or SAN?). Could you describe your disk
stack with more details?
Do you have any detailed metrics about disks and network IO to share?
The network is the same for both nodes?
All nodes have only local storage. The filesystem is ZFS, which has its own builtin caching (ARC/L2ARC & ZIL). There are no hardware caching devices present. The disks are connected using a Supermicro AOC-S3008L-L8E HBA (shown as LSI Logic / Symbios Logic SAS3008 PCI-Express Fusion-MPT SAS-3 (rev 02) with lspci). This is the layout of the pool:
[root@ph-sql-04 ter]# zpool status
pool: tank
state: ONLINE
scan: scrub repaired 0B in 0 days 00:07:51 with 0 errors on Tue Jul 16 03:17:52 2019
config:
NAME STATE READ WRITE CKSUM
tank ONLINE 0 0 0
mirror-0 ONLINE 0 0 0
sda ONLINE 0 0 0
sdb ONLINE 0 0 0
mirror-1 ONLINE 0 0 0
sdc ONLINE 0 0 0
sdd ONLINE 0 0 0
mirror-2 ONLINE 0 0 0
sde ONLINE 0 0 0
sdf ONLINE 0 0 0
mirror-3 ONLINE 0 0 0
sdg ONLINE 0 0 0
sdh ONLINE 0 0 0
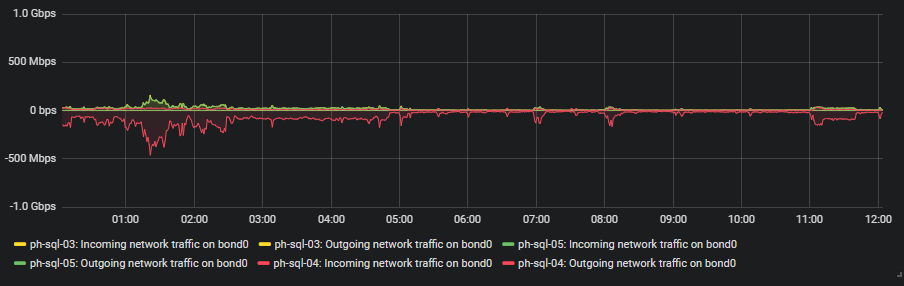
I've attached a graph of network IO on all servers. The network config is identical for all three nodes: 2x bonded gigabit connection to the same stacked switch pair.
Currently I don't have much metrics on raw disk IO, I can add some monitoring items and report those tomorrow if that would be useful. I do have a lot of metrics available related to PostgreSQL (buffers written/read, checkpoints, rows fetched/updated/inserted etc.)
Attachment:
network-pgdb2.PNG
Description: PNG image
