- During this performance issue, we found the following symptoms.
- Running queries do not return.
- The application sometimes can no longer get new connections.
- The CPU load increases
- There is no I/O wait.
- There is no swapping.
While the database was unavailable, we also collected a lot of data. Looking through this info, a few things pop-out to us, that may be problematic, or useful to notice.
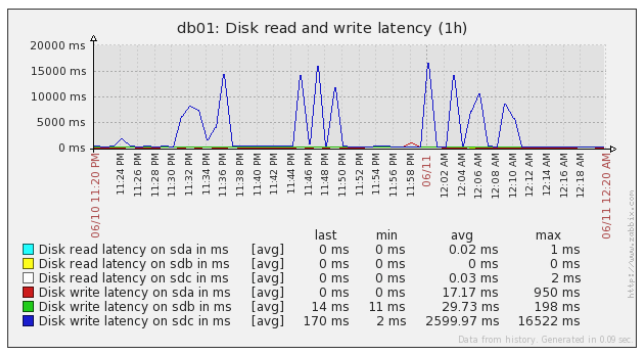
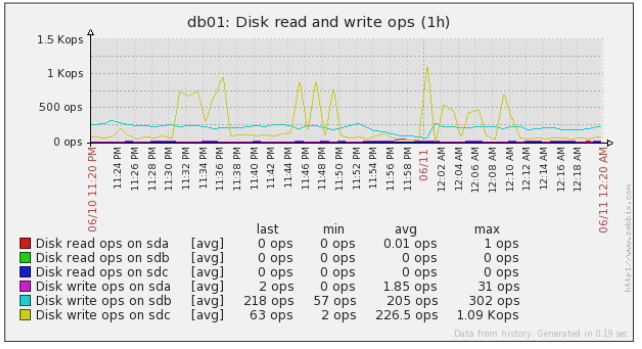
- Disk I/O appears to be all write, and little read.
- In previous incidents, with the same symptoms, we have seen pg processes spending much time in s_lock
- That info is attached to this email also, as files named perf_*.
Problem
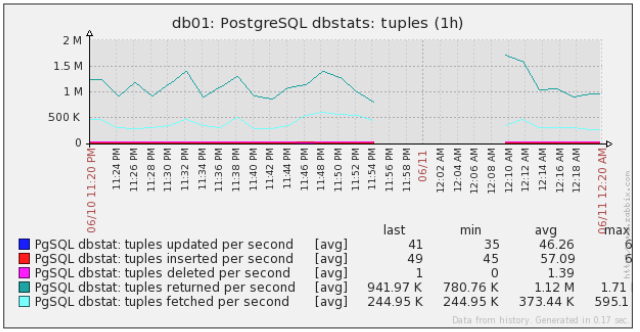
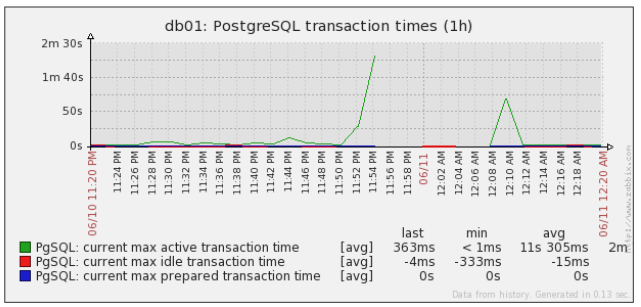
As you can probably see below, at 11:54, the DB stops returning rows.Also, transactions stop returning, causing the active transaction time to trend up to the sky.
Consequences of Problem
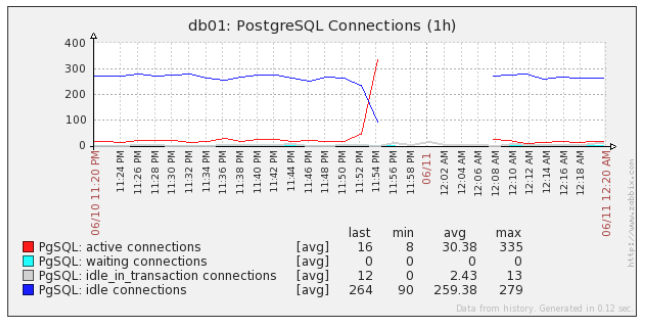
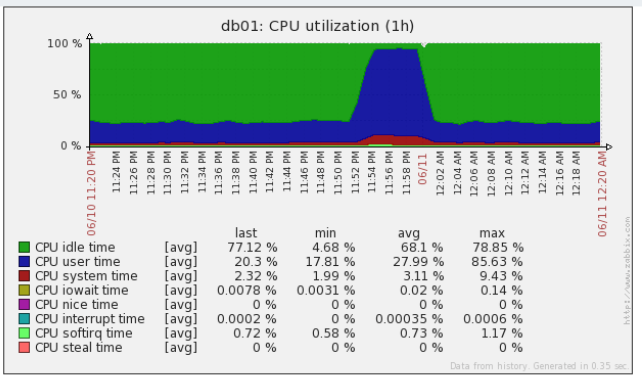
Once transactions stop returning, we see connections pile-up. Eventually, we reach a max, and clients can no longer connect.The cpu utilization increases to nearly 100%, in user space, and stays there, until the database is restarted.
Events Before Problem
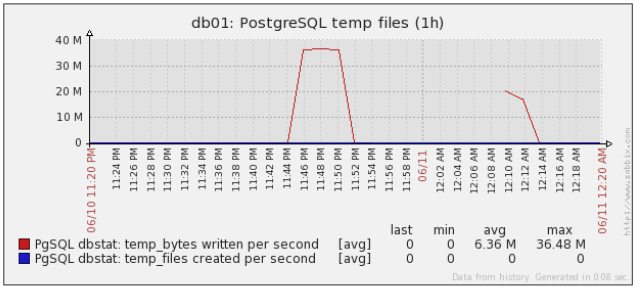
This is likely the most useful part. As the time approaches 11:54, there are periods of increased latency. There is also a marked increase in write operations, in general.Lastly, about 10 minutes before outage, postgres writes a sustained 30 MB/s of temp files.
After investigating this, we found a query that was greatly exceeding work_mem. We've since optimized it, and hopefully, that will have a positive effect on the above.
We may not know until the next issue happens, though.
With a problem like this, I am not exactly positive how to proceed. I am really looking forward to hearing your thoughts, and opinions, if you can share them.
Thanks very much,
-Chris
A description of what you are trying to achieve and what results you expect.

    We were trying to handle our normal production load.
    Spuriously, postgres becomes unresponsive, though.

The EXACT PostgreSQL version you are running.

    postgres (PostgreSQL) 9.2.6

Postgres Installation:

    Postgres is installed from the "PostgreSQL RPM Building Project".

    YUM Repo:       http://yum.postgresql.org/9.2/redhat/rhel-6-x86_64/
    Arch / Version: CentOS 6 - x86_64

Changes made to the settings in the postgresql.conf file:

    postgres=# SELECT version();
                                                       version
    --------------------------------------------------------------------------------------------------------------
     PostgreSQL 9.2.6 on x86_64-unknown-linux-gnu, compiled by gcc (GCC) 4.4.7 20120313 (Red Hat 4.4.7-3), 64-bit
    (1 row)

    postgres=# SELECT name, current_setting(name), source
    postgres-#   FROM pg_settings
    postgres-#   WHERE source NOT IN ('default', 'override');
                 name             |                 current_setting                  |        source
    ------------------------------+--------------------------------------------------+----------------------
     archive_command              | rsync -a %p 172.17.10.10:/backups/pg_archives/%f | configuration file
     archive_mode                 | on                                               | configuration file
     autovacuum                   | on                                               | configuration file
     autovacuum_freeze_max_age    | 1000000000                                       | configuration file
     autovacuum_max_workers       | 6                                                | configuration file
     checkpoint_completion_target | 0.9                                              | configuration file
     checkpoint_segments          | 256                                              | configuration file
     checkpoint_timeout           | 30min                                            | configuration file
     DateStyle                    | ISO, MDY                                         | configuration file
     default_text_search_config   | pg_catalog.english                               | configuration file
     effective_cache_size         | 176GB                                            | configuration file
     effective_io_concurrency     | 10                                               | configuration file
     lc_messages                  | en_US.UTF-8                                      | configuration file
     lc_monetary                  | en_US.UTF-8                                      | configuration file
     lc_numeric                   | en_US.UTF-8                                      | configuration file
     lc_time                      | en_US.UTF-8                                      | configuration file
     listen_addresses             | *                                                | configuration file
     log_autovacuum_min_duration  | 0                                                | configuration file
     log_checkpoints              | on                                               | configuration file
     log_destination              | stderr                                           | configuration file
     log_directory                | /var/log/postgres                                | configuration file
     log_filename                 | postgresql-%Y-%m-%d_%H%M%S.log                   | configuration file
     log_line_prefix              | %t [%p]: [%l-1]                                  | configuration file
     log_lock_waits               | on                                               | configuration file
     log_min_duration_statement   | 500ms                                            | configuration file
     log_rotation_age             | 1d                                               | configuration file
     log_rotation_size            | 0                                                | configuration file
     log_temp_files               | 0                                                | configuration file
     log_truncate_on_rotation     | on                                               | configuration file
     logging_collector            | on                                               | configuration file
     maintenance_work_mem         | 1GB                                              | configuration file
     max_connections              | 500                                              | configuration file
     max_stack_depth              | 2MB                                              | environment variable
     max_wal_senders              | 10                                               | configuration file
     pg_stat_statements.max       | 10000                                            | configuration file
     pg_stat_statements.track     | all                                              | configuration file
     port                         | 5432                                             | command line
     random_page_cost             | 2                                                | configuration file
     shared_buffers               | 6GB                                              | configuration file
     shared_preload_libraries     | pg_stat_statements                               | configuration file
     track_activities             | on                                               | configuration file
     track_counts                 | on                                               | configuration file
     vacuum_freeze_min_age        | 10000                                            | configuration file
     vacuum_freeze_table_age      | 500000000                                        | configuration file
     wal_buffers                  | 4MB                                              | configuration file
     wal_keep_segments            | 1536                                             | configuration file
     wal_level                    | hot_standby                                      | configuration file
     work_mem                     | 256MB                                            | configuration file
    (48 rows)


Operating system and version

    $ uname -a
    Linux db01 2.6.32-431.3.1.el6.x86_64 #1 SMP Fri Jan 3 21:39:27 UTC 2014 x86_64 x86_64 x86_64 GNU/Linux

    $ cat /etc/redhat-release
    CentOS release 6.5 (Final)

For questions about any kind of error:
    What you were doing when the error happened / how to cause the error.
    The EXACT TEXT of the error message you're getting if there is one. Copy and paste the message to the email, do not send a screenshot.

What program you're using to connect to PostgreSQL

    The python library psycopg2 version 2.5.2

If you're using a connection pool, load balancer or application server, which one you're using and its version

    We are using 18 instances of pgbouncer.
    pgbouncer version 1.5.4 (compiled by <postgres@koji-sl6-x86-64-pg92> at 2012-12-10 11:22:04)

Is there anything remotely unusual in the PostgreSQL server logs?

    Preceeding crash:
        2014-06-10 22:53:51 GMT [52621]: [1-1] ERROR:  relation "pg_buffercache" does not exist at character 22
        2014-06-10 22:48:28 GMT [48822]: [1-1] ERROR:  syntax error at or near "pg_sleep" at character 1
        2014-06-10 21:39:05 GMT [80406]: [9-1] ERROR:  syntax error in tsquery: "[Route()]:*AB "
        2014-06-10 21:21:23 GMT [12348]: [2-1] DETAIL:  Key (user_id)=(2743403) already exists.
        2014-06-10 21:21:23 GMT [12348]: [1-1] ERROR:  duplicate key value violates unique constraint "google_googleprofile_user_id_key"

    Preceeding crash:
        2014-06-10 03:33:12 GMT [18339]: [1-1] FATAL:  remaining connection slots are reserved for non-replication superuser connections
        2014-06-10 03:32:14 GMT [17907]: [7-1] FATAL:  connection to client lost
        2014-06-10 03:32:10 GMT [17964]: [1-1] FATAL:  sorry, too many clients already
        2014-06-10 00:58:46 GMT [38934]: [8-1] HINT:  No function matches the given name and argument types. You might need to add explicit type cast


CPU manufacturer and model

    80 Cores

    vendor_id       : GenuineIntel
    model name      : Intel(R) Xeon(R) CPU E7- 4850  @ 2.00GHz
    cpu MHz         : 1995.010
    cache size      : 24576 KB
    flags           : fpu vme de pse tsc msr pae mce cx8 apic sep mtrr pge mca cmov pat pse36 clflush dts acpi mmx fxsr sse sse2 ss ht tm pbe syscall nx pdpe1gb rdtscp lm constant_tsc arch_perfmon pebs bts rep_good xtopology nonstop_tsc aperfmperf pni pclmulqdq dtes64 monitor ds_cpl vmx smx est tm2 ssse3 cx16 xtpr pdcm pcid dca sse4_1 sse4_2 x2apic popcnt aes lahf_lm ida arat dts tpr_shadow vnmi flexpriority ept vpid
    bogomips        : 3990.02

Amount and size of RAM installed, eg "2GB RAM"

    250 GB RAM

Storage details (important for performance and corruption questions)

    Do you use a RAID controller?

        Yes.

    If so, what type of controller?

        Product Name:          PERC H700 Integrated
        Memory:                1024 MB
        BBU:                   Present
        Number of DISK GROUPS: 4
        Chipset:               LSI Logic / Symbios Logic MegaRAID SAS 2108 [Liberator] (rev 05)


    Does it have a battery backed cache module?

        Yes.

    Is write-back caching enabled?

        Yes.

    Do you use software RAID?

        No.

Is your PostgreSQL database on a SAN?

    No.

How many hard disks are connected to the system and what types are they?

     2x - Dell SSD - 46.5 GB
    14x - SEAGATE ST9146853SS - 146GB 15000 RPM 64MB Cache SAS 6Gb/s

How are your disks arranged for storage?

    Are you using RAID?

        Yes

    If so, what RAID level(s)?

        Virtual Drive Id  Drive Type  Drive Name       Size       RAID Type    Num Disks   Cache Policy
        ------------------------------------------------------------------------------------------------------------------
                       0  Virtual     Virtual Disk 0   136.1 GB   1 - Mirror           2   WriteBack, ReadAdaptive, Direct
                       1  CacheCade   CacheCade         92.0 GB   0 - Stripe           2   WriteBack, ReadAdaptive, Direct
                       2  Virtual     xlog             136.1 GB   1 - Mirror           2   WriteBack, ReadAdaptive, Direct
                       3  Virtual     data             680.6 GB   1 - Mirror          10   WriteBack, ReadAdaptive, Direct

    What PostgreSQL data is on what disks / disk sets?

        Drive Name       Mount Point      Filesystem  Postgres Use   Disk Distribution
        ----------------------------------------------------------------------------------
        Virtual Disk 0   /boot, /         ext3        None            2x - 146GB 15000 SAS
        xlog             /pg_xlog         ext3        xlog            2x - 146GB 15000 SAS
        data             /var/lib/pgsql   ext3        data           10x - 146GB 15000 SAS

        Device       Mount Point      Options
        ----------------------------------------------------------
        /dev/sda1 on /boot            ext4 (rw)
        /dev/sdb1 on /pg_xlog         ext4 (rw,noatime,nodiratime)
        /dev/sdc1 on /var/lib/pgsql   ext4 (rw,noatime,nodiratime)
Attachment:
postgresql.conf
Description: Binary data
Attachment:
perf_example_vmstat
Description: Binary data
Attachment:
perf_example_dmesg
Description: Binary data
Attachment:
perf_example_ipcs
Description: Binary data
blocked_pid,blocked_user,blocking_pid,blocking_user,blocked_statement
Attachment:
perf_example_pginfo
Description: Binary data
Attachment:
perf_example_ps_auxfww
Description: Binary data
Attachment:
perf_example_iotop
Description: Binary data
Attachment:
perf_example_strace.47700
Description: Binary data
Attachment:
perf_example_backtrace.47700
Description: Binary data
Attachment:
perf_example_stack.47700
Description: Binary data
Attachment:
perf_example_status.47700
Description: Binary data
Attachment:
perf_example_strace.46462
Description: Binary data
Attachment:
perf_example_syscall.47700
Description: Binary data
Attachment:
perf_example_backtrace.46462
Description: Binary data
Attachment:
perf_example_stack.46462
Description: Binary data
Attachment:
perf_example_status.46462
Description: Binary data
Attachment:
perf_example_strace.29561
Description: Binary data
Attachment:
perf_example_syscall.46462
Description: Binary data
Attachment:
perf_example_backtrace.29561
Description: Binary data
Attachment:
perf_example_stack.29561
Description: Binary data
Attachment:
perf_example_status.29561
Description: Binary data
Attachment:
perf_example_syscall.29561
Description: Binary data
Attachment:
perf_example_strace.81372
Description: Binary data
Attachment:
perf_example_backtrace.81372
Description: Binary data
Attachment:
perf_example_stack.81372
Description: Binary data
Attachment:
perf_example_status.81372
Description: Binary data
Attachment:
perf_example_syscall.81372
Description: Binary data
Attachment:
perf_example_vacuum
Description: Binary data
