Hi everyone,
I'm writing to ask about a correlation I was surprised to observe on our PSQL machines (particularly read-only standbys) where increasing "shared_buffers" appears to result in increased pg_stat_database.blk_read_time and CPU iowait, which in turn seems to correlate with reduced throughput for our query-heavy services - details below.
Is this expected, or are there configuration changes we might make to improve the performance at higher "shared_buffers" values?
Thanks, let me know if I can provide any more info,
Jordan
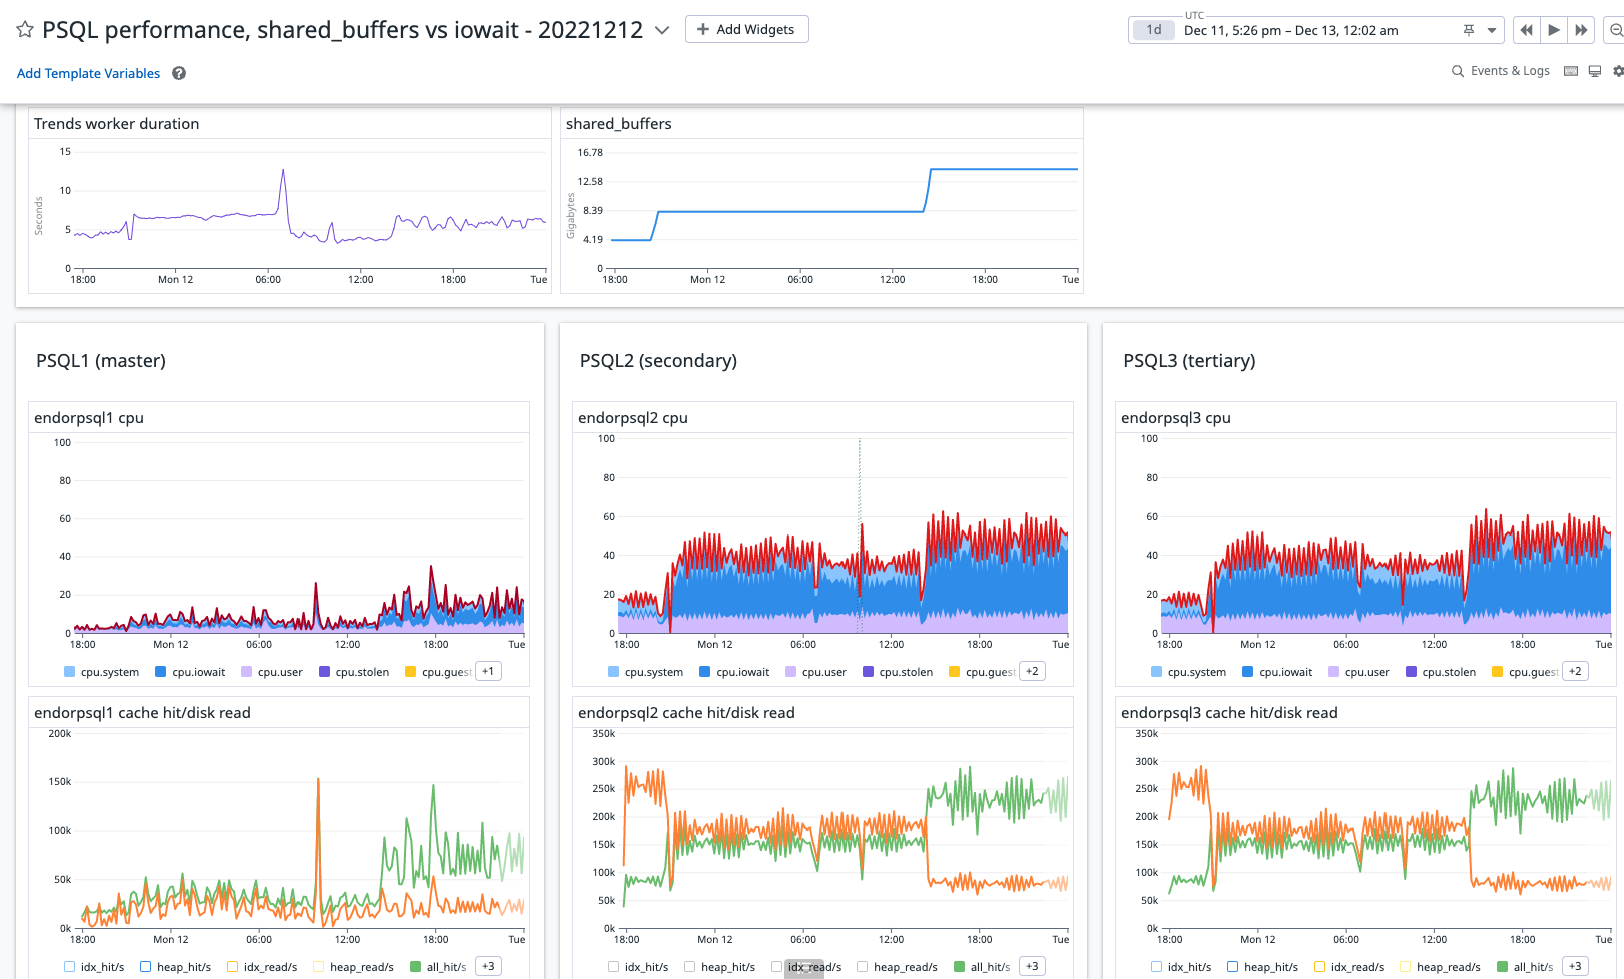
- Tests and results - public Datadog dashboard here, screenshot attached:
- Our beta system ("endor") was run with three different configurations over the ~30hrs from Dec 11 17:00 to Dec 13 0:00 (UTC)
- The only changes between these deployments was the "shared_buffers" parameter for all PSQL instances (machine and configuration details below).
- "shared_buffers" = "4000MB" - from Dec 10 19:00 to Dec 11 20:00 UTC
- "shared_buffers" = "8000MB" - from Dec 11 21:00 to Dec 12 13:30 UTC
- "shared_buffers" = "14000MB" - from Dec 12, 14:30 to Dec 13, 0:00 UTC
- The datadog dashboard shows our results including cpu divided by usage and the cache hit vs disk read ratio including blk_read_time (additional metrics were enabled at about Dec 11, 10am PST)
- Our most query heavy service is our "Trends worker" for which the average worker duration is shown in the top-left graph
- We expect the workload to be relatively constant throughout this period, particularly focusing on the standby instances (PQSL2 and PSQL3) where all read-only queries should be sent.
- We see the lowest duration, i.e. best performance, most consistently with the lowest setting for shared_buffers, "4000MB"
- As we increase shared_buffers we see increased iowait on the standby instances (PSQL2 and PSQL3) and increased blk_read_time (per pg_stat_database), in the bottom-most graphs as "blks_read_time".
- Even though we also see a higher ratio of cache hits on those instances. Our graphs show the per second change in pg_stat_database.blks_read abd blks_hit (as "all_hit/s" and "all_read/s") and pg_statio_user_tables.heap_blks_read, heap_blks_hit, idx_blks_read, and idx_blks_hit
- Cluster contains 3 PSQL nodes, all on AWS EC2 instances, postgresql.conf attached
- Version: psql (PostgreSQL) 14.1
- Machine:
- AWS "c6gd.4xlarge" (32GB RAM, 16 core 2.5 GHz, local storage 950 GB ssd)
- uname -a: Linux ip-172-30-64-110 5.4.0-1038-aws #40-Ubuntu SMP Fri Feb 5 23:53:34 UTC 2021 aarch64 aarch64 aarch64 GNU/Linux
- Replication via WAL:
- Line configuration: PSQL1 (master), PSQL1 followed by PSQL2, PSQL2 followed by PSQL3
- Managed by repmgr (version: repmgr 5.3.0), no failovers observed during timeframe of interest
- Load balancing:
- Managed by PGPool-II (version: 4.3.2 (tamahomeboshi)) on 3 AWS instances
- All write queries go to master. All read-only queries go to standbys unless WAL on standby > 10MB, falling back to read from master as last resort
Attachment:
datadog_psql_shared_buf_perf_20221212.png
Description: PNG image
Attachment:
postgresql.conf
Description: Binary data
