Is either half of the AND estimated correctly? If you do a query
with only ">=", and a query with only "<=", do either of them give an accurate
rowcount estimate ?
Dropping >= results in the correct index being used. Dropping <= doesn't have this effect.
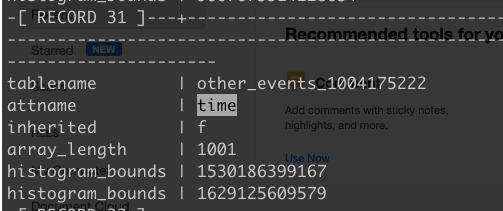
Could you send the histogram bounds for "time" ?

Could you check pg_stat_all_tables and be sure the last_analyzed is recent for
both parent and child tables ?
Looks
like I forgot to ANALYZE the other_events partition, but Postgres is
still using the wrong index either way (unless I drop >=, as mentioned above). Here are the results:

On Thu, Aug 12, 2021 at 7:20 PM Justin Pryzby <pryzby@xxxxxxxxxxxxx> wrote:
On Thu, Aug 12, 2021 at 09:38:45AM -0400, Matt Dupree wrote:
> > The rowcount estimate for the time column is bad for all these plans - do you
> > know why ? You're using inheritence - have you analyzed the parent tables recently ?
>
> Yes. I used ANALYZE before posting, as it's one of the "things to try"
> listed in the slow queries wiki. I even ran the queries immediately after
> analyzing. No difference. Can you say more about why the bad row estimate
> would cause Postgres to use the bigger index? I would expect Postgres to
> use the smaller index if it's over-estimating how many rows will be
> returned.
The overestimate is in the table's "time" column (not index) and applies to all
the plans. Is either half of the AND estimated correctly? If you do a query
with only ">=", and a query with only "<=", do either of them give an accurate
rowcount estimate ?
|Index Scan using other_events_1004175222_pim_evdef_67951aef14bc_idx on public.other_events_1004175222 (cost=0.28..1,648,877.92 rows=1,858,891 width=32) (actual time=1.008..15.245 rows=23 loops=1)
|Index Cond: ((other_events_1004175222."time" >= '1624777200000'::bigint) AND (other_events_1004175222."time" <= '1627369200000'::bigint))
It seems like postgres expects the scan to return a large number of matching
rows, so tries to use the more selective index which includes the "type"
column. But "type" is not very selective either (it has only 4 distinct
values), and "time" is not the first column, so it reads a large fraction of
the table, slowly.
Could you check pg_stat_all_tables and be sure the last_analyzed is recent for
both parent and child tables ?
Could you send the histogram bounds for "time" ?
SELECT tablename, attname, inherited, array_length(histogram_bounds,1), (histogram_bounds::text::text[])[1], (histogram_bounds::text::text[])[array_length(histogram_bounds,1)]
FROM pg_stats ... ;
--
Justin
--
