Hi,
I have two machines - one with 8GB RAM & 4core CPU and the other with 64GB Ram & 24 core CPU. Both machines have the
same DB (Postgres 12 + Postgis 2.5.3). Same query is taking less time
in low end machine whereas more time in high end machine. Any thoughts
on where to look? I have tuned the db in both machines according to https://pgtune.leopard.in.ua/#/, the function will refer around 14 tables, since both the tables are have same index and views.
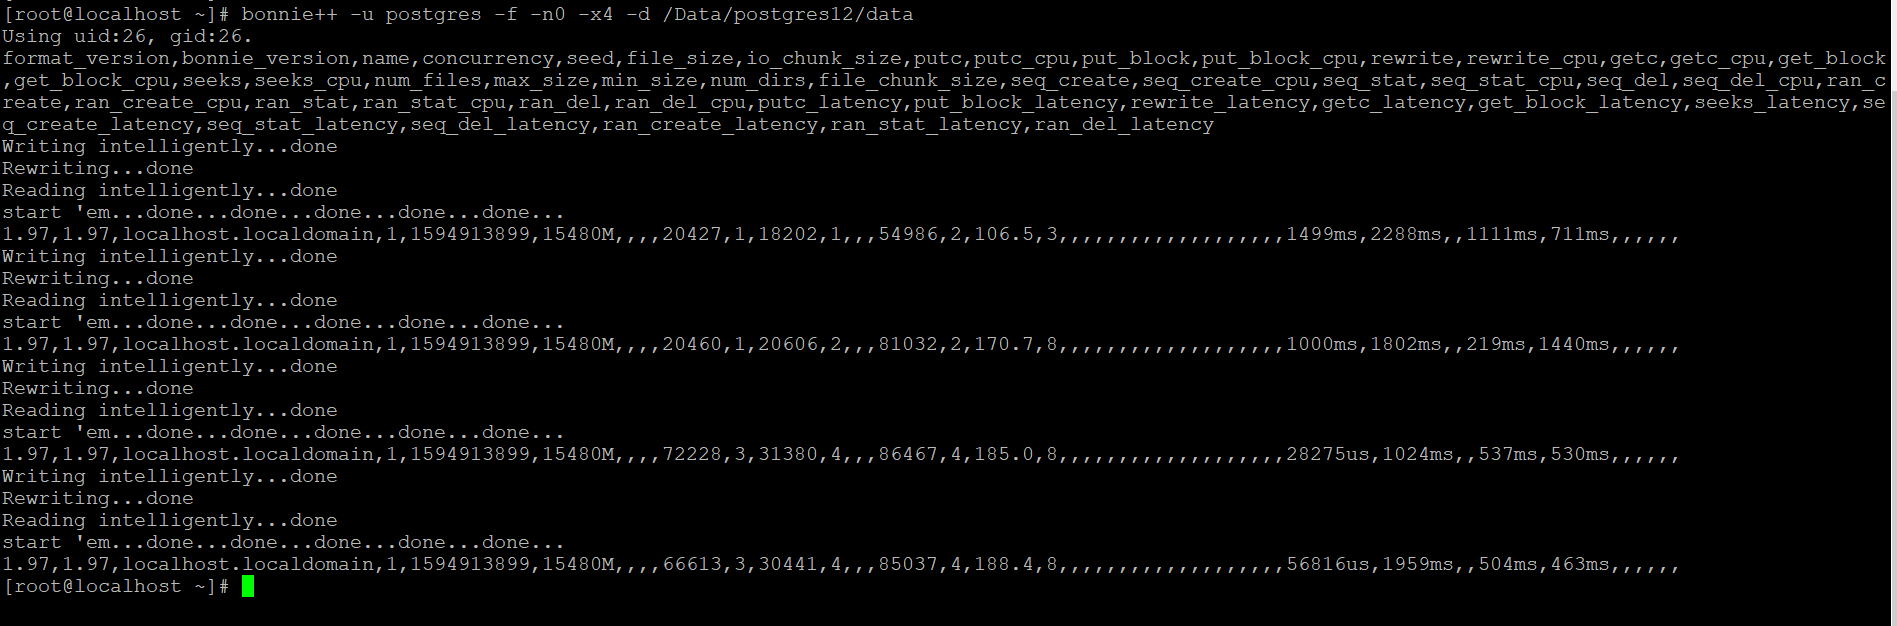
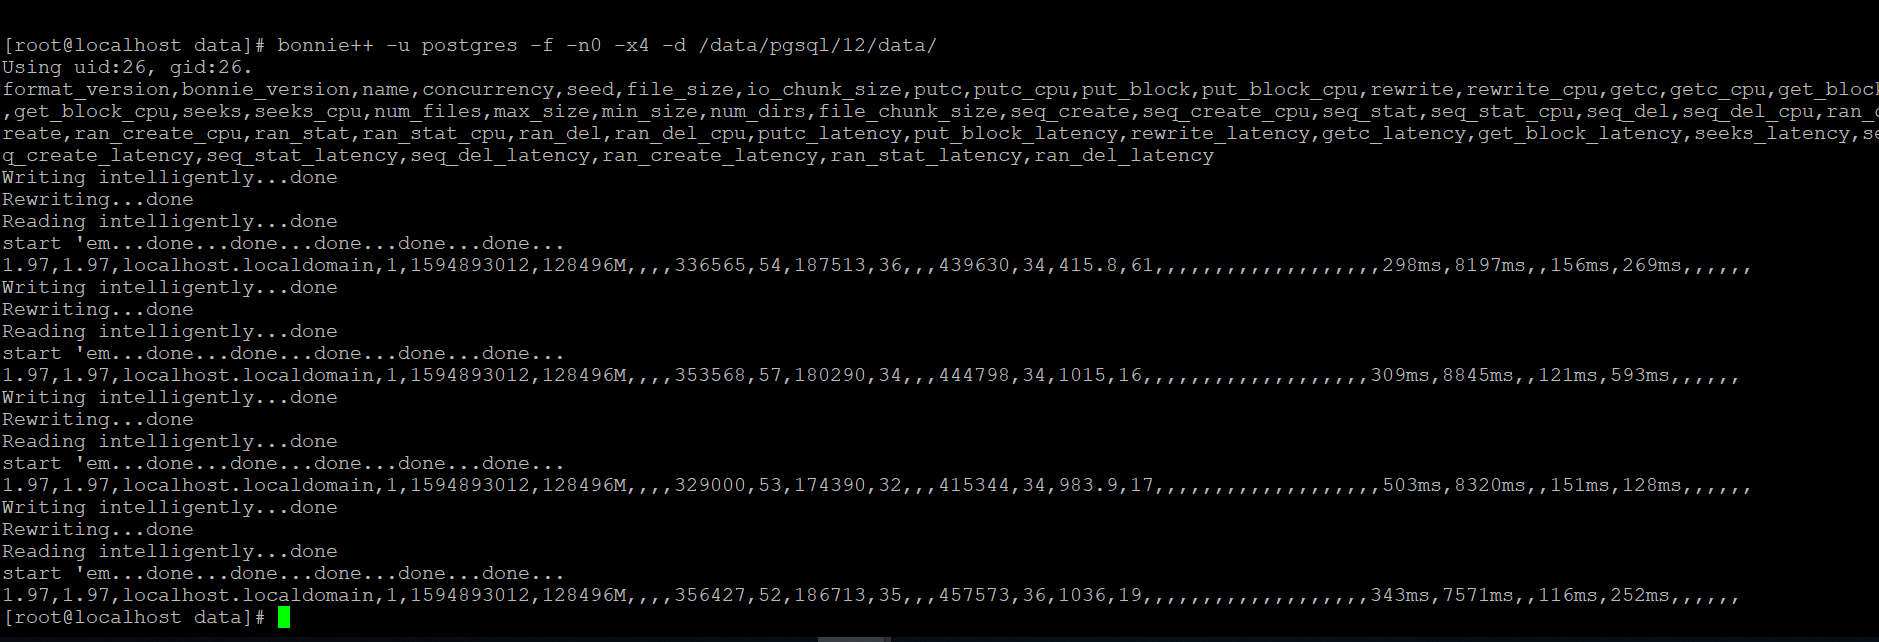
Please find the attachment for query explain & analyze and bonnie result of both the machines.
Low End Machine
-bash-4.2$ psql -p 5434
psql (12.3)
Type "help" for help.
postgres=# \c IPDS_KSEB;
You are now connected to database "IPDS_KSEB" as user "postgres".
IPDS_KSEB=# explain analyze select * from kseb_geometry_trace_with_barrier_partition(5,'kottarakara_version',437,'htline',2) ;
QUERY PLAN
---------------------------------------------------------------------------------------------------------------------------------------------------------
Function Scan on kseb_geometry_trace_with_barrier_partition (cost=0.25..10.25 rows=1000 width=169) (actual time=11626.548..11626.568 rows=254 loops=1)
Planning Time: 0.212 ms
Execution Time: 11628.590 ms
High End Machine
-bash-4.2$ psql -p 5422
psql (12.3)
Type "help" for help.
postgres=# \c IPDS_KSEB;
You are now connected to database "IPDS_KSEB" as user "postgres".
IPDS_KSEB=# explain analyze select * from kseb_geometry_trace_with_barrier_partition(5,'kottarakara_version',437,'htline',2) ;
QUERY PLAN
---------------------------------------------------------------------------------------------------------------------------------------------------------
Function Scan on kseb_geometry_trace_with_barrier_partition (cost=0.25..10.25 rows=1000 width=169) (actual time=22304.425..22304.448 rows=254 loops=1)
Planning Time: 0.219 ms
Execution Time: 22352.219 ms
(3 rows)
Attachment:
bonnie++result_Low End Machine.PNG
Description: PNG image
Attachment:
bonnie++result_High End Machine.PNG
Description: PNG image
