I am going to reply to my own message to add more information
that I think can be interesting for others.
I find that IO contention continues being a number one issue for
streamlining database performance (it's a duh! but it's
significant sticky point!)
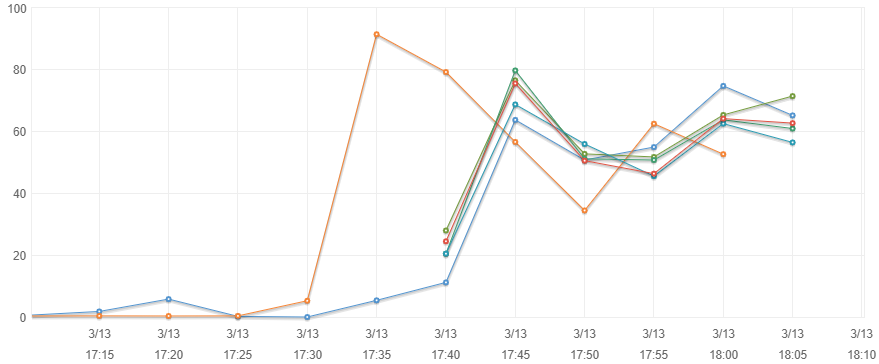
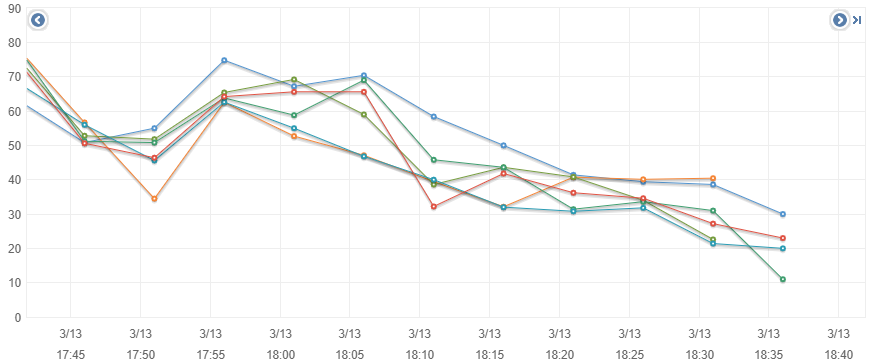
I told you my performance was again going down the drain rapidly.
In my case it's going so fast because the database is filling up
fast with all that heavy load activity. I still don't know if
autovacuum is running well. But when I tried to manually vacuumdb
I noticed the number of dead rows relatively small, so I don't
think that the lack of vacuuming was an issue.
I have a bottleneck though.
There is one massive table, let's call it Foo, and in Foo there
is also significant amount of toasted text, and there is a child
table called Foo_id then two indexes on Foo_id. Here the
essentials:
CREATE TABLE Foo {
  internalId UUID PRIMARY KEY,
  ... -- tons of columns
  text_xml text, -- lot's of stuff to toast
  ... -- tons of more columns
};

CREATE TABLE Foo_id {
  fooInternalId UUID REFERENCES Foo(internalId),
  prefix text,
  suffix text
}

CREATE INDEX Foo_id_fkidx ON Foo_id(fooInternalId);
CREATE INDEX Foo_id_idx ON Foo_id(prefix, suffix);
Now, it so happens that the activity on that index is so large that
this volume has 100% io utilization per iostat and everyone is at
75% iowait:
Device:         rrqm/s   wrqm/s     r/s     w/s    rkB/s    wkB/s avgrq-sz avgqu-sz   await r_await w_await  svctm  %util
nvme8n1           0.00     0.00   69.00   45.00   880.00   400.00    22.46     8.79   90.95   88.64   94.49   8.77 100.00
However, the only really heavily used data file here really is
just that Foo_id_idx. That one index!
I think I have a few ways to alleviate the bottleneck:
- partition that Foo_id table so that that index would be
partitioned too and I can spread it out over multiple volumes.
- build a low level "spreading" scheme which is to take the
partial files 4653828 and 4653828.1, .2, _fsm, etc. and move
each to another device and then symlink it back to that
directory (I come back to this!)
- maybe I can only partition the index by using the WHERE clause
on the CREATE INDEX over some hash function of the Foo_id.prefix
column.
- maybe I can configure in AWS EBS to reserve more IOPS -- but
why would I pay for more IOPS if my cost is by volume size? I
can just make another volume? or does AWS play a similar trick
on us with IOPS being limited on some "credit" system???
To 1. I find it surprisingly complicated to have to create a
partitioned table only in order to spread an index over multiple
volumes.
To 2. I find that it would be a nice feature of PostgreSQL if we
could just use symlinks and a symlink rule, for example, when
PostgreSQL finds that 4653828 is in fact a symlink to
/otherdisk/PG/16284/4653828, then it would
- by default also create 4653828.1 as a symlink and place the
actual data file on /otherdisk/PG/16284/4653828.1
- or even easier: it would allow the admin to pre-create the
datafiles or even just the symlinks to not yet extisting
datafiles, so that when it comes to create the 4653828.2 it will
do it wherever that symlink points to, either a broken symlink
whose target will then be created, or a symlink to a zero-size
file that was already pre-created.
- and also easier, allow us to pre-set the size of the data
files with truncate --size $target_size so that PostgreSQL will
use the next .1, .2, .3 file once the target size has been
reached, rather than filling up all those 4 GB
- I think that if, as I find, the wisdom to "divide data over
spindles" is still true, then it would be best if PostgreSQL had
a distribution scheme which is not at the logical data model
level (partition ... tablespace), but rather just on the low
level.
That last point I just made up. But it is extremely useful if
PostgreSQL would have this sort of very very simple intelligence.
To 3. if I create the index like this:
CREATE INDEX Foo_id_idx ON Foo_id(prefix, suffix) WHERE hashmod(prefix,4) = 0 TABLESPACE /tbs/Foo_id_0;
CREATE INDEX Foo_id_idx ON Foo_id(prefix, suffix) WHERE hashmod(prefix,4) = 1 TABLESPACE /tbs/Foo_id_1;
CREATE INDEX Foo_id_idx ON Foo_id(prefix, suffix) WHERE hashmod(prefix,4) = 2 TABLESPACE /tbs/Foo_id_2;
CREATE INDEX Foo_id_idx ON Foo_id(prefix, suffix) WHERE hashmod(prefix,4) = 3 TABLESPACE /tbs/Foo_id_3;
with some appropriately defined hashmod function that divides up
4 approximately equal partitions.
Is there any downside to this approach? It looks to me that this
does everything partitioning scheme would also do, i.e., (1)
routing inserted tuples into the right file, and (2) resolving
which file to refer to based on the data of the query. What am I
missing?
regards,
-Gunther
On 3/13/2019 14:44, Gunther wrote:
Hello again. You may remember my queue issue for which some of
you have proposed to use a partitioned table approach. I have
done that, and I might report more on that once I have this
beast all tamed, which may be now. Let's say in short, it
definitely helped immensely. My test case now is different from
what I had previously done. I am now hammering my database with
52 worker threads uploading like crazy into some 100 tables and
indexes.
Right now I want to remind everybody of the surprising fact
that the old wisdom of distributing load over "spindles" appears
to be still true even in the virtualized world of cloud
computing. For background, this is running on Amazon AWS, the db
server is a c5.xlarge and you see I have 0.0 st, because my
virtual CPUs are dedicated.
I had run into a situation which was totally crazy. Here I show
you a snapshot of top and iostat output as it ran all night with
totally low tps.
top - 12:43:42 up 1 day,  9:29,  3 users,  load average: 41.03, 39.58, 38.91
Tasks: 385 total,   1 running, 169 sleeping,   0 stopped,   0 zombie
%Cpu(s):  2.9 us,  0.9 sy,  0.0 ni,  5.9 id, 90.3 wa,  0.0 hi,  0.1 si,  0.0 st
KiB Mem :  7809760 total,   130528 free,   948504 used,  6730728 buff/cache
KiB Swap:        0 total,        0 free,        0 used.  4357496 avail Mem

  PID USER      PR  NI    VIRT    RES    SHR S  %CPU %MEM     TIME+ COMMAND
20839 postgres  20   0 2309448  86892  83132 D   1.0  1.1   0:00.04 postgres: auser integrator 172.31.49.159(44862) SELECT
17230 postgres  20   0 2318736   1.7g   1.7g D   0.7 23.0   0:10.00 postgres: auser integrator 172.31.49.159(44458) SELECT
19209 postgres  20   0 2318760   1.7g   1.7g D   0.7 22.7   0:04.89 postgres: auser integrator 172.31.54.158(44421) SELECT
19467 postgres  20   0 2318160   1.8g   1.8g D   0.7 23.6   0:04.20 postgres: auser integrator 172.31.61.242(56981) INSERT
19990 postgres  20   0 2318084   1.2g   1.2g D   0.7 16.1   0:02.12 postgres: auser integrator 172.31.63.71(50413) SELECT
20004 postgres  20   0 2317924 863460 853052 D   0.7 11.1   0:02.10 postgres: auser integrator 172.31.63.71(21895) INSERT
20555 postgres  20   0 2316952 899376 890260 D   0.7 11.5   0:00.65 postgres: auser integrator 172.31.61.242(60209) INSERT
20786 postgres  20   0 2312208 736224 729528 D   0.7  9.4   0:00.22 postgres: auser integrator 172.31.63.71(48175) INSERT
18709 postgres  20   0 2318780   1.9g   1.8g D   0.3 24.9   0:06.18 postgres: auser integrator 172.31.54.158(17281) SELECT
19228 postgres  20   0 2318940   1.7g   1.7g D   0.3 22.4   0:04.63 postgres: auser integrator 172.31.63.71(63850) INSERT
19457 postgres  20   0 2318028   1.1g   1.1g D   0.3 15.0   0:03.69 postgres: auser integrator 172.31.54.158(33298) INSERT
19656 postgres  20   0 2318080   1.3g   1.3g D   0.3 18.1   0:02.90 postgres: auser integrator 172.31.61.242(23307) INSERT
19723 postgres  20   0 2317948   1.3g   1.2g D   0.3 16.8   0:02.17 postgres: auser integrator 172.31.49.159(44744) SELECT
20034 postgres  20   0 2318044 927200 916924 D   0.3 11.9   0:02.19 postgres: auser integrator 172.31.63.71(64385) SELECT
20080 postgres  20   0 2318124   1.2g   1.2g D   0.3 15.6   0:01.90 postgres: auser integrator 172.31.63.71(23430) INSERT
20264 postgres  20   0 2317824   1.0g   1.0g D   0.3 13.9   0:01.28 postgres: auser integrator 172.31.54.158(64347) INSERT
20285 postgres  20   0 2318096 582712 572456 D   0.3  7.5   0:01.08 postgres: auser integrator 172.31.63.71(34511) INSERT
20392 root      20   0       0      0      0 I   0.3  0.0   0:00.05 [kworker/u8:1]
19954 postgres  20   0 2317848   1.2g   1.2g D   0.3 15.8   0:01.95 postgres: auser integrator 172.31.61.242(65080) SELECT
20004 postgres  20   0 2317924 863460 853052 D   0.3 11.1   0:02.08 postgres: auser integrator 172.31.63.71(21895) INSERT
20034 postgres  20   0 2318044 923876 913600 D   0.3 11.8   0:02.18 postgres: auser integrator 172.31.63.71(64385) SELECT
20080 postgres  20   0 2318124   1.2g   1.1g D   0.3 15.6   0:01.89 postgres: auser integrator 172.31.63.71(23430) SELECT
20248 postgres  20   0 2318312 598416 587972 D   0.3  7.7   0:01.14 postgres: auser integrator 172.31.63.71(44375) SELECT
20264 postgres  20   0 2317824   1.0g   1.0g D   0.3 13.9   0:01.27 postgres: auser integrator 172.31.54.158(64347) INSERT
20350 postgres  20   0 2318228 546652 536396 D   0.3  7.0   0:00.87 postgres: auser integrator 172.31.54.158(60787) INSERT
20590 postgres  20   0 2317208 893232 883840 D   0.3 11.4   0:00.61 postgres: auser integrator 172.31.61.242(14003) INSERT
20595 postgres  20   0 2317172 884792 875428 D   0.3 11.3   0:00.59 postgres: auser integrator 172.31.54.158(59843) INSERT
20603 postgres  20   0 2316596 838408 829668 D   0.3 10.7   0:00.50 postgres: auser integrator 172.31.61.242(16697) INSERT
20770 postgres  20   0  171388   4456   3628 R   0.3  0.1   0:00.13 top -c
you can see here that all these postgress processes are in
"non-interruptible sleep" (D) state. CPU% is ridiculously low
(and that's not because of steal, c5 instances do not run on
"CPU credits"). Are they all in IO blocked state? Let's see
iostat:
avg-cpu:  %user   %nice %system %iowait  %steal   %idle
           2.51    0.00    0.75   94.99    0.00    1.75

Device:         rrqm/s   wrqm/s     r/s     w/s    rkB/s    wkB/s avgrq-sz avgqu-sz   await r_await w_await  svctm  %util
nvme1n1           0.00     0.00    0.00    0.00     0.00     0.00     0.00     0.00    0.00    0.00    0.00   0.00   0.00
nvme2n1           0.00     0.00    0.00    0.00     0.00     0.00     0.00     0.00    0.00    0.00    0.00   0.00   0.00
nvme3n1           0.00     0.00    0.00    0.00     0.00     0.00     0.00     0.00    0.00    0.00    0.00   0.00   0.00
nvme4n1           0.00     0.00    1.00    5.00     8.00    27.50    11.83     0.00    0.00    0.00    0.00   0.00   0.00
nvme8n1           0.00     0.00    0.00    0.00     0.00     0.00     0.00     0.00    0.00    0.00    0.00   0.00   0.00
nvme9n1           0.00     0.00   91.00    2.00  3040.00     3.00    65.44     0.00    0.65    0.66    0.00   0.04   0.40
nvme11n1          0.00     2.00    0.00   24.00     0.00  1090.00    90.83     0.00    0.00    0.00    0.00   0.00   0.00
nvme10n1          0.00     0.00    0.00    0.00     0.00     0.00     0.00     0.00    0.00    0.00    0.00   0.00   0.00
nvme6n1           0.00     0.00    0.00    0.00     0.00     0.00     0.00     0.00    0.00    0.00    0.00   0.00   0.00
nvme7n1           0.00     0.00    0.00    0.00     0.00     0.00     0.00     0.00    0.00    0.00    0.00   0.00   0.00
nvme12n1          0.00     0.00    0.00    0.00     0.00     0.00     0.00     0.00    0.00    0.00    0.00   0.00   0.00
nvme5n1           0.00     0.00    0.00    0.00     0.00     0.00     0.00     0.00    0.00    0.00    0.00   0.00   0.00
nvme16n1          0.00     0.00    0.00    0.00     0.00     0.00     0.00     0.00    0.00    0.00    0.00   0.00   0.00
nvme15n1          0.00     0.00    0.00    2.00     0.00     1.50     1.50     0.00    0.00    0.00    0.00   0.00   0.00
nvme13n1          0.00     0.00    0.00    0.00     0.00     0.00     0.00     0.00    0.00    0.00    0.00   0.00   0.00
nvme14n1          0.00     0.00    0.00    0.00     0.00     0.00     0.00     0.00    0.00    0.00    0.00   0.00   0.00
nvme17n1          0.00     0.00    0.00    0.00     0.00     0.00     0.00     0.00    0.00    0.00    0.00   0.00   0.00
nvme18n1          0.00     0.00  194.00  133.00  1896.00  3253.50    31.50     6.90   23.27   31.18   11.73   2.46  80.40
nvme19n1          0.00     0.00    6.00   13.00    48.00   355.50    42.47     0.00    0.00    0.00    0.00   0.00   0.00
nvme20n1          0.00     0.00    0.00    0.00     0.00     0.00     0.00     0.00    0.00    0.00    0.00   0.00   0.00
nvme21n1          0.00     0.00    0.00    0.00     0.00     0.00     0.00     0.00    0.00    0.00    0.00   0.00   0.00
nvme22n1          0.00     0.00    0.00    0.00     0.00     0.00     0.00     0.00    0.00    0.00    0.00   0.00   0.00
nvme23n1          0.00     0.00    0.00    0.00     0.00     0.00     0.00     0.00    0.00    0.00    0.00   0.00   0.00
nvme0n1           0.00     0.00    0.00    7.00     0.00    69.50    19.86     0.00    0.00    0.00    0.00   0.00   0.00
You see that I already did a lot to balance IO out to many
different tablespaces that's why there are so many volumes. Yet
my iowait % was at > 95%. I though all my user data was
spread out over the tablespaces, so that I could control the IO
contention. But there remained a crazy hotspot on this nvme18n1
volume. And it turns out that was the data/base default
tablespace, and that I had failed to actually assign proper
tablespaces to many of the tables.
Now I brought the server to a maintenance halt killing and
blocking all the worker threads from connecting again during the
move, and then did the tablespace move.
ALTER DATABASE integrator CONNECTION LIMIT 0;
SELECT pg_terminate_backend(pid)
  FROM pg_stat_activity
 WHERE datname = 'integrator'
   AND pid <> pg_backend_pid()
   AND backend_type = 'client backend';
ALTER TABLE integrator.... SET TABLESPACE ...;
...
ALTER TABLE integrator.... SET TABLESPACE ...;
ALTER DATABASE integrator CONNECTION LIMIT -1;
And then look at what this helped:
avg-cpu:  %user   %nice %system %iowait  %steal   %idle
          38.90    0.00   10.47   13.97    0.00   36.66

Device:         rrqm/s   wrqm/s     r/s     w/s    rkB/s    wkB/s avgrq-sz avgqu-sz   await r_await w_await  svctm  %util
nvme1n1           0.00     0.00    9.00   37.00    72.00   296.00    16.00     0.00    0.52    0.44    0.54   0.00   0.00
nvme2n1           0.00     0.00  129.00  467.00  1152.00  4152.00    17.80     0.13    0.47    0.25    0.53   0.18  10.80
nvme3n1           0.00     0.00    8.00   38.00    64.00   304.00    16.00     0.00    0.61    0.50    0.63   0.00   0.00
nvme4n1           0.00     0.00    8.00   43.00    64.00   344.00    16.00     0.00    0.47    0.00    0.56   0.00   0.00
nvme8n1           0.00     0.00  326.00 1104.00  3452.00 10248.00    19.16     0.56    0.58    0.39    0.64   0.15  20.80
nvme9n1           0.00     0.00   29.00   71.00   232.00   568.00    16.00     0.00    0.64    0.41    0.73   0.00   0.00
nvme11n1          0.00     0.00    0.00  193.00     0.00 37720.00   390.88     0.66    4.15    0.00    4.15   0.58  11.20
nvme10n1          0.00     0.00  185.00  281.00  1560.00  2264.00    16.41     0.06    0.51    0.58    0.46   0.10   4.80
nvme6n1           0.00     0.00   14.00  137.00   112.00  1096.00    16.00     0.00    0.42    0.00    0.47   0.03   0.40
nvme7n1           0.00     0.00    0.00    0.00     0.00     0.00     0.00     0.00    0.00    0.00    0.00   0.00   0.00
nvme12n1          0.00     0.00  267.00  584.00  2656.00  4864.00    17.67     0.23    0.53    0.54    0.53   0.19  16.40
nvme5n1           0.00     0.00   22.00   14.00   176.00   112.00    16.00     0.00    0.78    1.09    0.29   0.00   0.00
nvme16n1          0.00     0.00   75.00  179.00   732.00  1432.00    17.04     0.01    0.55    0.32    0.65   0.05   1.20
nvme15n1          0.00     0.00    0.00   16.00     0.00   128.00    16.00     0.00    1.25    0.00    1.25   0.00   0.00
nvme13n1          0.00     0.00  185.00  631.00  1804.00  5904.00    18.89     0.21    0.47    0.28    0.53   0.16  13.20
nvme14n1          0.00     0.00  141.00  227.00  1128.00  1816.00    16.00     0.02    0.48    0.57    0.42   0.05   2.00
nvme17n1          0.00     0.00   69.00  250.00   704.00  2000.00    16.95     0.00    0.44    0.41    0.45   0.00   0.00
nvme18n1          0.00     0.00    9.00    9.00    72.00    72.00    16.00     0.00    0.00    0.00    0.00   0.00   0.00
nvme19n1          0.00     0.00  137.00  294.00  1576.00  3088.00    21.64     0.07    0.56    0.82    0.44   0.14   6.00
nvme20n1          0.00     0.00  191.00  693.00  1796.00  6336.00    18.40     0.37    0.65    0.44    0.70   0.20  18.00
nvme21n1          0.00     0.00   90.00  140.00   856.00  1120.00    17.18     0.01    0.56    0.36    0.69   0.05   1.20
nvme22n1          0.00     0.00  426.00  859.00  4016.00  7272.00    17.57     0.40    0.54    0.60    0.52   0.14  18.40
nvme23n1          0.00     0.00  512.00  916.00  5076.00 10288.00    21.52     0.50    0.53    0.36    0.63   0.12  17.20
nvme0n1           0.00     0.00    0.00    0.00     0.00     0.00     0.00     0.00    0.00    0.00    0.00   0.00   0.00
And top:
top - 18:08:13 up 1 day, 14:54, 10 users,  load average: 4.89, 6.09, 4.93
Tasks: 395 total,   4 running, 161 sleeping,   0 stopped,   0 zombie
%Cpu(s): 55.6 us,  8.8 sy,  0.0 ni, 18.9 id, 14.2 wa,  0.0 hi,  2.4 si,  0.0 st
KiB Mem :  7809760 total,   136320 free,   610204 used,  7063236 buff/cache
KiB Swap:        0 total,        0 free,        0 used.  4693632 avail Mem

  PID USER      PR  NI    VIRT    RES    SHR S  %CPU %MEM     TIME+ COMMAND
13601 postgres  20   0 2319104   1.9g   1.9g S  40.2 25.9   0:18.76 postgres: auser integrator 172.31.54.158(15235) idle
13606 postgres  20   0 2318832   1.6g   1.6g S  18.6 21.7   0:14.25 postgres: auser integrator 172.31.54.158(49226) idle i+
13760 postgres  20   0 2318772   1.7g   1.7g S  17.6 23.4   0:11.09 postgres: auser integrator 172.31.57.147(45312) idle i+
13600 postgres  20   0 2318892   1.9g   1.9g R  15.6 26.1   0:20.08 postgres: auser integrator 172.31.54.158(63958) BIND
13603 postgres  20   0 2318480   1.8g   1.8g S  15.3 24.0   0:22.72 postgres: auser integrator 172.31.57.147(23817) idle i+
13714 postgres  20   0 2318640   1.8g   1.8g S  15.3 24.0   0:10.99 postgres: auser integrator 172.31.63.71(58893) idle in+
13607 postgres  20   0 2318748   1.9g   1.9g S  14.6 25.8   0:19.59 postgres: auser integrator 172.31.57.147(11889) idle
13844 postgres  20   0 2318260 730388 719972 S  13.0  9.4   0:02.03 postgres: auser integrator 172.31.61.242(58949) idle i+
13716 postgres  20   0 2318816   1.8g   1.8g S  12.3 24.2   0:11.94 postgres: auser integrator 172.31.63.71(53131) idle in+
13717 postgres  20   0 2318752   1.6g   1.6g S  10.3 21.0   0:13.39 postgres: auser integrator 172.31.63.71(19934) idle in+
13837 postgres  20   0 2318296 805832 795380 S  10.3 10.3   0:02.28 postgres: auser integrator 172.31.61.242(63185) idle i+
13839 postgres  20   0 2317956 722788 712532 S  10.3  9.3   0:02.04 postgres: auser integrator 172.31.49.159(57414) idle i+
13836 postgres  20   0 2318188 697716 687224 R  10.0  8.9   0:02.09 postgres: auser integrator 172.31.61.242(51576) INSERT
13846 postgres  20   0 2317716   1.3g   1.3g S  10.0 17.0   0:02.19 postgres: auser integrator 172.31.61.242(16349) idle i+
13854 postgres  20   0 2313504 224276 216592 S   7.3  2.9   0:00.42 postgres: auser integrator 172.31.61.242(18867) idle i+
18055 postgres  20   0 2308060   2.1g   2.1g S   7.0 27.6   3:04.07 postgres: checkpointer
13602 postgres  20   0 2319160   1.8g   1.8g S   6.6 23.9   0:21.21 postgres: auser integrator 172.31.54.158(45183) idle i+
13833 postgres  20   0 2317848 879168 869312 S   6.0 11.3   0:02.90 postgres: auser integrator 172.31.61.242(47892) idle i+
13710 postgres  20   0 2318856   1.4g   1.4g S   5.6 19.3   0:09.89 postgres: auser integrator 172.31.63.71(22184) idle in+
13809 postgres  20   0 2318168   1.1g   1.1g D   4.7 14.4   0:04.94 postgres: auser integrator 172.31.63.71(44808) SELECT
13843 postgres  20   0 2318276 595844 585432 S   4.0  7.6   0:01.36 postgres: auser integrator 172.31.61.242(39820) idle i+
13860 postgres  20   0 2311872 139372 133356 R   3.7  1.8   0:00.11 postgres: auser integrator 172.31.49.159(57420) idle i+
  462 root      20   0       0      0      0 S   1.7  0.0   1:41.44 [kswapd0]
13859 postgres  20   0 2308104  96788  93884 S   1.7  1.2   0:00.05 postgres: auser integrator 172.31.61.242(43391) idle i+
18057 postgres  20   0 2305108  19108  18624 S   1.7  0.2   1:26.62 postgres: walwriter
 1559 root       0 -20       0      0      0 I   0.3  0.0   0:19.21 [kworker/1:1H]
 1560 root       0 -20       0      0      0 I   0.3  0.0   0:25.19 [kworker/3:1H]
 2619 root      20   0   13144    400    292 S   0.3  0.0   0:28.52 /sbin/rngd -f
This helped!
There is a nice saturation now of CPU at the high end of the
"linear" range, i.e., we aren't in the distortion range or
>90% and yet all workers are runn

I can do 17 transactions per second with 52 parallel worker
threads. Now we have not run yet for over an hour but so far so
good. With my old non-partitioned work queue table I would have
long run into the index degradation.
I am not sure my autovacuum setup is working right though. I
wonder if there isn't some autovacuum statistics which I can
query that would give me confidence that it is actually running?
Finally the last question for now: I would like to set the XFS
(all file systems are XFS) block size to the same size as the
PostgreSQL page size. I am surprized this isn't a recommended
action to take? It would seem to make sense to reduce IO system
calls and push entire pages in one fell swoop every time. Right?
regards,
-Gunther
PS: aaaaand we're going down. Ran vacuumdb again, but that
didn't help much. It's going down again.


