On 8/21/22 14:55, Kenny Bachman wrote:
Hi Mladen,
Thank you for your help.
Yes, the plan is huge, because there is a view object. The system has a very low load today and there are 2-3 active sessions normally, no long-running query.I checked the activity view, and there is no wait event for my query, which has a NULL value for the wait event column.
Here is my memory status:
total used free shared buff/cache available
Mem: 251 6 1 24 243 220
How can we explain the cache doesn't work as expected? I mean, I expect more performant the second or third time running because of the cache. However, every time I run it I get the same exec time value.Hi Kenny,
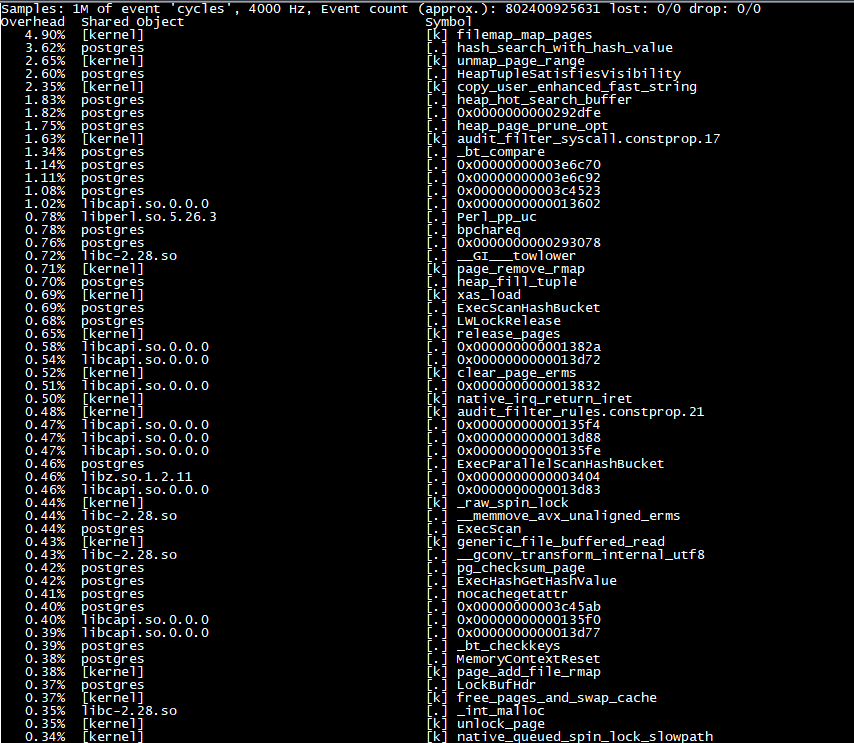
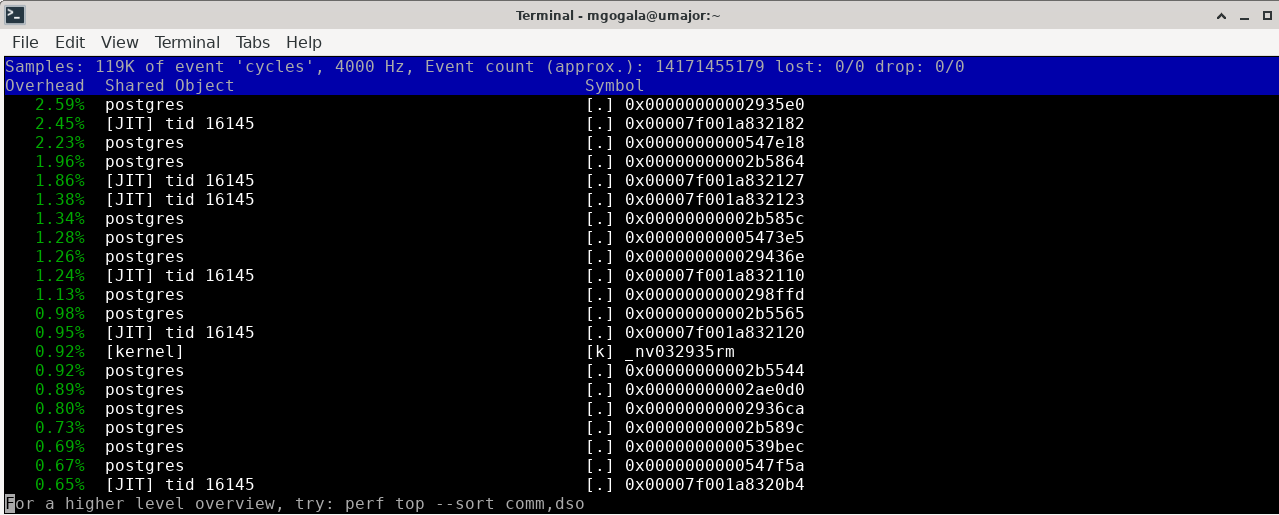
Please follow the execution with "perf top". If you get something like this:
then your problem may be with the JIT component. Jit has large influence on the execution speed:
scott=# \timing on
Timing is on.
scott=# set jit=on;
SET
Time: 0.359 ms
scott=# select count(*) from emp e1,emp e2,emp e3,emp e4,emp e5,emp e6,emp e7;
count
-----------
105413504
(1 row)
Time: 3785.608 ms (00:03.786)
scott=# set jit=off;
SET
Time: 0.278 ms
scott=# select count(*) from emp e1,emp e2,emp e3,emp e4,emp e5,emp e6,emp e7;
count
-----------
105413504
(1 row)
Time: 4660.464 ms (00:04.660)In my case, JIT speeds things up. However, I am aware of the situations when JIT slows things down. BTW, what you've just described demonstrates the need for a reliable event tracing mechanism, which was once suggested by Jeff Holt.
Regards
--
Mladen Gogala
Database Consultant
Tel: (347) 321-1217
https://dbwhisperer.wordpress.com

