On Mon, Dec 21, 2020 at 11:27 AM Tom Lane <tgl@xxxxxxxxxxxxx> wrote:
However, I don't think I believe the assertion that the system wasn't
under overall memory pressure. What we see in the quoted log fragment
is two separate postmaster fork-failure reports interspersed with a
memory context map, which has to have been coming out of some other
process because postmaster.c does not dump its contexts when reporting
a fork failure. But there's no reason for a PG process to dump a
context map unless it suffered an ENOMEM allocation failure.
(It'd be interesting to look for the "out of memory" error that presumably
follows the context map, to see if it offers any more info.)
I have included the only detail in the logs. Everything else is
query timings and undetailed out of memory log entries.
If you think it could be useful, I can grab all of the log
lines between 9:15 and 9:20 AM.
So what we have is fork() being unhappy concurrently with ENOMEM
problems in at least one other process. That smells like overall
memory pressure to me, cacti or no cacti.
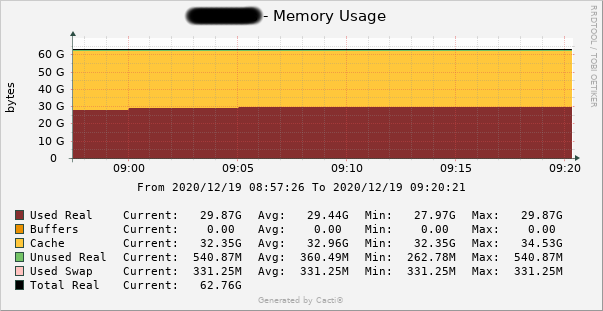
If this did pop the memory limit of the system, then it somehow more than doubled the memory
usage from less than 30GB to greater than 64 GB (80GB including another 16 GB of swap),
usage from less than 30GB to greater than 64 GB (80GB including another 16 GB of swap),
spat out the error, then resumed running at exactly the memory consumption it had
previous (there is no perceivable bump in the graph), all in under the 5 minute sampling rate from cacti.
previous (there is no perceivable bump in the graph), all in under the 5 minute sampling rate from cacti.

The cacti/snmp numbers are accurate when I compare the running system with results
from free command on shell.
Cacti can produce compressed averaged graphs when viewed much later, but I took
this snapshot within the hour of the event, as we were called in to handle the outage.
this snapshot within the hour of the event, as we were called in to handle the outage.
There are errors from Postgres at 09:16 and 09:19 of unable to fork due to memory.
In fact, the last out of memory error has a time stamp of 09:19:54 (converting from GMT).
Cacti samples the system info over snmp at 09:15 and 09:20. That would be
a remarkable feat for it to land back at almost the exact same memory footprint
In fact, the last out of memory error has a time stamp of 09:19:54 (converting from GMT).
Cacti samples the system info over snmp at 09:15 and 09:20. That would be
a remarkable feat for it to land back at almost the exact same memory footprint
6 seconds later. This kind of thing happens at magic shows, not in IT.
If you've got cgroups enabled, or if the whole thing is running
inside a VM, there might be kernel-enforced memory limits somewhere.
We didn't intentionally run cgroups, but out of the box, Redhat Linux 6 does configure "slabs"
of memory for cgroup support. If that was disabled, we would save 1.6 GB of memory, so
I will look into that kernel option to disable it, but it doesn't explain what we saw.
I will look into that kernel option to disable it, but it doesn't explain what we saw.
We are running it within VMware. I will ask the admin of that if there could be
anything limiting memory access.
anything limiting memory access.
Thanks for the analysis thus far.
