hello everyone,
i have PostgreSQL 9.5.3 server running on redhalt 6.6
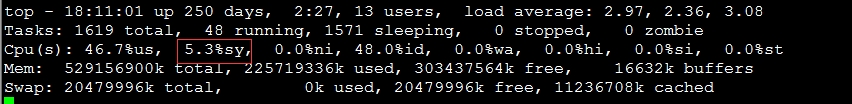
when i run one query with pgbench the cpu is 80% and sy% is 60%
top
Cpu(s): 12.0%us, 53.0%sy,  0.0%ni, 35.0%id,  0.0%wa,  0.0%hi,  0.0%si,  0.0%st
Mem:  529156900k total, 515292840k used, 13864060k free,   486228k buffers
Swap: 20479996k total,        0k used, 20479996k free, 291651484k cached
perf top
Samples: 12M of event 'cycles', Event count (approx.): 2442425371133
 65.96%  [kernel]               [k] osq_lock
  5.15%  [kernel]               [k] _spin_lock_irqsave
  1.35%  postgres               [.] SearchCatCache
  1.18%  [kernel]               [k] mutex_spin_on_owner
  1.06%  postgres               [.] slot_deform_tuple
  0.87%  postgres               [.] AllocSetAlloc
  0.72%  [kernel]               [k] _spin_lock
  0.68%  postgres               [.] LWLockAcquire
  0.57%  postgres               [.] ExecInitExpr
  0.55%  libc-2.12.so           [.] vfprintf
  0.46%  postgres               [.] pg_encoding_mbcliplen
  0.43%  postgres               [.] TupleDescInitEntry
  0.40%  [kernel]               [k] schedule
  0.25%  libc-2.12.so           [.] _int_malloc
  0.25%  postgres               [.] hash_search_with_hash_value
  0.25%  libc-2.12.so           [.] memcpy
  0.25%  postgres               [.] PinBuffer
  0.24%  libc-2.12.so           [.] __strlen_sse42
  0.22%  postgres               [.] LWLockRelease
  0.20%  [kernel]               [k] update_curr
  0.19%  postgres               [.] MemoryContextAllocZeroAligned
  0.19%  [kernel]               [k] select_idle_sibling
  0.18%  [kernel]               [k] native_write_msr_safe
  0.17%  postgres               [.] varstr_cmp
  0.17%  libc-2.12.so           [.] __strncpy_ssse3
  0.17%  [kernel]               [k] task_rq_lock
  0.16%  [kernel]               [k] select_task_rq_fair
  0.16%  postgres               [.] UnpinBuffer.clone.0
  0.16%  postgres               [.] GetSnapshotData
  0.16%  [kernel]               [k] __mutex_lock_slowpath
  0.14%  [kernel]               [k] mutex_lock
1.the query runing is 2.7ms
2.query explain
Limit (cost=14.60..14.60 rows=1 width=262) (actual time=0.093..0.093 rows=1 loops=1)
-> Sort (cost=14.60..14.60 rows=1 width=262) (actual time=0.091..0.091 rows=1 loops=1)
Sort Key: a.order_date DESC
Sort Method: quicksort Memory: 25kB
-> Nested Loop Left Join (cost=0.84..14.59 rows=1 width=262) (actual time=0.055..0.074 rows=1 loops=1)
-> Nested Loop Left Join (cost=0.57..12.67 rows=1 width=289) (actual time=0.049..0.067 rows=1 loops=1)
-> Index Scan using table_name_1_user_id_idx on table_name_1 a (cost=0.43..6.50 rows=1 width=233) (actual time=0.037..0.054 rows=1 loops=1)
Index Cond: ((user_id)::text = 'xxxxxxxx'::text)
Filter: (((checkin_date)::text >= '20170223'::text) AND ((checkin_date)::text <= '20170224'::text) AND ((valid_flag)::text = '1'::text) AND ((order_state)::text = A
NY ('{2,3,4,5,8,B}'::text[])))
Rows Removed by Filter: 36
-> Index Scan using idx_table_name_2 on table_name_2 b (cost=0.14..6.16 rows=1 width=56) (actual time=0.002..0.003 rows=1 loops=1)
Index Cond: ((a.company_id)::text = (company_id)::text)
-> Index Scan using idx_table_name_3 on table_name_3 ca (cost=0.27..1.90 rows=1 width=35) (actual time=0.003..0.004 rows=1 loops=1)
Index Cond: ((b.company_id)::text = (company_id)::text)
Planning time: 0.965 ms
Execution time: 0.294 ms
3.sql
SELECT
A .column_name,
A .column_name,
A .column_name,
A .column_name,
A .column_name,
A .column_name,
A .column_name,
A .column_name,
A .column_name,
A .column_name,
A .column_name,
A .column_name,
A .column_name,
A .column_name,
b. column_name,
A .column_name,
A .column_name,
A .column_name,
A .column_name,
A .column_name,
ca.column_name,
FROM
table_name_1 A
LEFT JOIN table_name_2 b ON (A .company_id = b.company_id)
LEFT JOIN table_name_3 ca ON (b.company_id = ca.company_id)
WHERE
A .valid_flag = '1'
AND A .user_id = 'xxxxxxxx'
AND A .checkin_date >= '20170223'
AND A .checkin_date <= '20170224'
AND A .order_state IN ('2', '3', '4', '5', '8', 'B')
ORDER BY
A .order_date DESC
LIMIT 3 OFFSET 0;
A .column_name,
A .column_name,
A .column_name,
A .column_name,
A .column_name,
A .column_name,
A .column_name,
A .column_name,
A .column_name,
A .column_name,
A .column_name,
A .column_name,
A .column_name,
A .column_name,
b. column_name,
A .column_name,
A .column_name,
A .column_name,
A .column_name,
A .column_name,
ca.column_name,
FROM
table_name_1 A
LEFT JOIN table_name_2 b ON (A .company_id = b.company_id)
LEFT JOIN table_name_3 ca ON (b.company_id = ca.company_id)
WHERE
A .valid_flag = '1'
AND A .user_id = 'xxxxxxxx'
AND A .checkin_date >= '20170223'
AND A .checkin_date <= '20170224'
AND A .order_state IN ('2', '3', '4', '5', '8', 'B')
ORDER BY
A .order_date DESC
LIMIT 3 OFFSET 0;
(16 rows)
i reindex table_name_1_user_id_idx and try again is of no use.
i drop the btree index table_name_1_user_id_idx
create index table_name_1_user_id_idx on talbe_name_1 using hash(user_id);
vacuum analyze table_name_1
then the cpu is normal !!!!
I am very confused ,please help me find out the reasons for this situation
thank your!
