Hi there!
So the server is: HP DL380 G9 Dual Socket Octo Core Intel Xeon E5-2630v3 2.4GHz 128 GB RAM
So the server is: HP DL380 G9 Dual Socket Octo Core Intel Xeon E5-2630v3 2.4GHz 128 GB RAM
It's a production server, so I can't "play" with it.
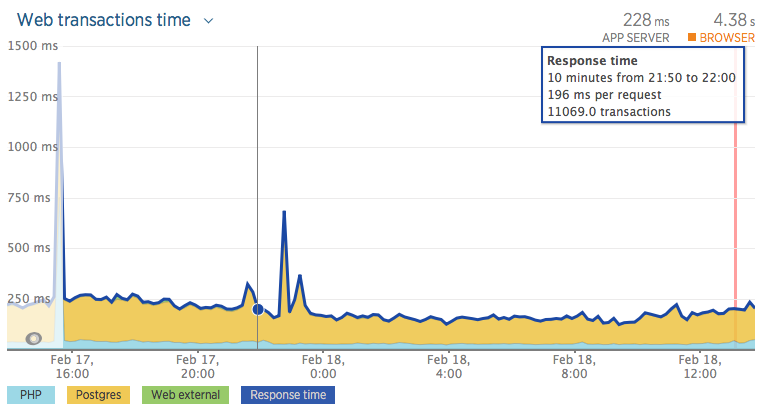
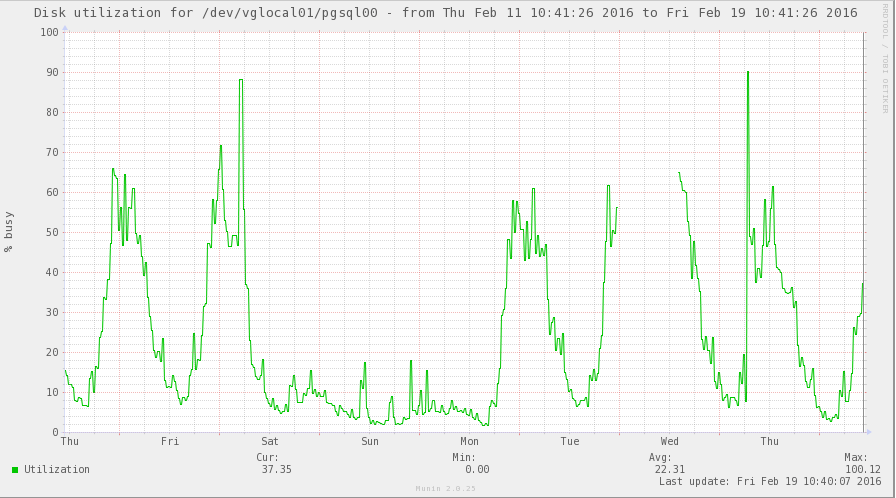
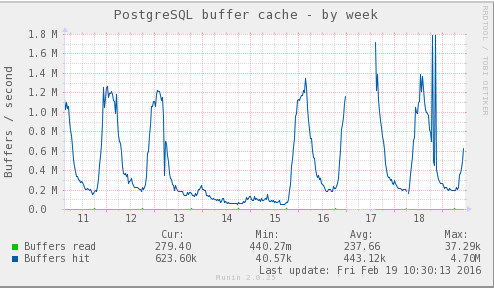
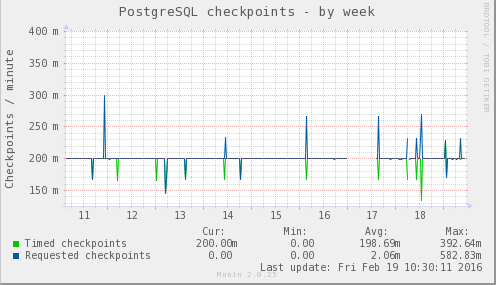
I'll post here some graphs about the SPIKE I had yesterday (2016-02-18) - Note that the spike isn't so big, but usually they are.
Disk utilization during that period

PostgreSQL buffer cache during that period:
Postgres checkpoints:
There are a lot of things you can do to improve performance, but we
don't know your usage patterns or underlying IO subsystem. What does
your IO sybsystem look like? How fast can you get something like
pgbench to go on this machine?
Might I ask where the idea for shared_buffers being 51GB came from?
Generally speaking shared_buffers don't work well that big, except in
some very specific circumstances maybe.
The shared_buffers idea, was made by the previous DBA.
So when you say IO is 100% utilized, is that being used by sorts, the
background writer, reads?
How many active and idle connections do you typically have on this
machine? If you have a lot of connections have you considered pooling?
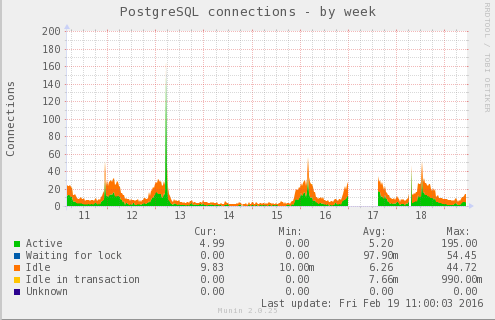
What are max_connections, effective_io_concurrency, ramdom_page_cost,
wal_writer_delay, commit_delay, commit_siblings, checkpoint_segments,
temp_buffers, set to?
max_connections = 200
effective_io_concurrency = 0
wal_writer_delay = 200ms
commit_delay = 0
#####commit_siblings = 5
checkpoint_segments = 64
#####ramdom_page_cost (Couldn't find that parameter in postgresql.conf)
temp_buffers = 16MB
Turn on things like log_temp_files, log_checkpoints.
They are already on:
log_temp_files = 4096
log_checkpoints = on
Also got a slow query and an explain analyze output?
Sometimes slow queries are INSERT/UPDATEs ... so no explain analyze for them
