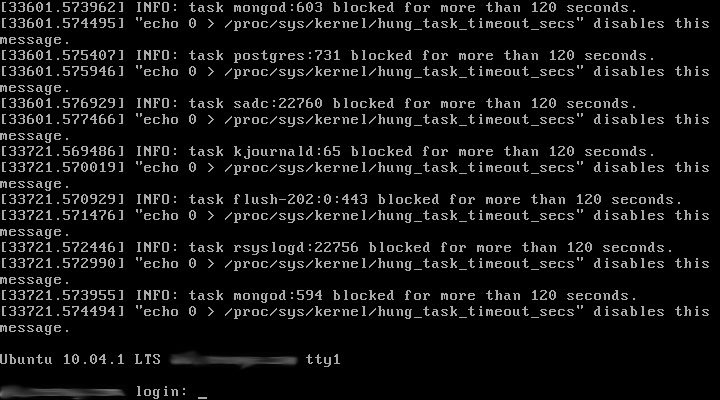
Just putting a follow up on this issue as it is still unresolved.
I worked with a PostgreSQL sys admin and they could not find anything amiss with the server or configuration.Then I talked to the hosting company (Liquid Web) and they said the parent (it is on a Bare Metal Storm server) had a hardware problem. Last week I moved to a new server (did a clone) and it went to a new parent as well as new hardware.

Aaron
==================================================================
Aaron Bono
Aranya Software Technologies, Inc.
http://www.aranya.com
http://codeelixir.com
==================================================================
Aaron Bono
Aranya Software Technologies, Inc.
http://www.aranya.com
http://codeelixir.com
==================================================================
On Tue, Nov 13, 2012 at 4:12 PM, Aaron Bono <aaron.bono@xxxxxxxxxx> wrote:
I have been struggling with an issue on our database server lately with Postgres crashing our server by taking up too much RAM. To alleviate this problem, I just upgraded from a 6 GB RAM server to a new 32 GB RAM server. The new server is running Ubuntu 10 with nothing but PostgreSQL 8.4.14 installed.Today, after being in use for only 24 hours, it hung the server again. Now, when I run a check on memory usage, I get a quickly growing amount of RAM being used:free -mt
total used free shared buffers cached
Mem: 30503 20626 9876 0 143 15897
-/+ buffers/cache: 4586 25917
Swap: 1913 0 1913
Total: 32417 20626 11790Additionally, I see using ps that Postgres is the only process using over 0.1 % of the RAM.Here is a sample of the PS command for some of the Postgres processes (there are currently a little over 200 active connections to the database):ps axuf....postgres 3523 0.5 1.0 426076 313156 ? Ss 08:44 2:42 \_ postgres: myuser my_db 192.168.1.2(39786) idlepostgres 3820 0.4 0.9 418988 302036 ? Ss 09:04 2:11 \_ postgres: myuser my_db 192.168.1.2(52110) idlepostgres 3821 0.1 0.5 391452 178972 ? Ss 09:04 0:44 \_ postgres: myuser my_db 192.168.1.2(52111) idlepostgres 3822 0.0 0.0 369572 9928 ? Ss 09:04 0:00 \_ postgres: myuser my_db 192.168.1.2(52112) idlepostgres 3823 0.2 0.6 383368 202312 ? Ss 09:04 1:12 \_ postgres: myuser my_db 192.168.1.2(52114) idlepostgres 3824 0.0 0.0 369320 8820 ? Ss 09:04 0:00 \_ postgres: myuser my_db 192.168.1.2(52115) idlepostgres 3825 0.4 0.8 413964 257040 ? Ss 09:04 1:54 \_ postgres: myuser my_db 192.168.1.2(52116) idle....Am I reading this right? Are there individual connections using over 300 MB or RAM by themselves? This seems excessive. (Note I am not a system admin exactly so please correct me if I am reading this wrong.)My postgresql.conf looks like this (I have only included the non-commented lines):data_directory = '/var/lib/postgresql/8.4/main'hba_file = '/etc/postgresql/8.4/main/pg_hba.conf'ident_file = '/etc/postgresql/8.4/main/pg_ident.conf'external_pid_file = '/var/run/postgresql/8.4-main.pid'listen_addresses = 'localhost,192.168.1.200'port = 5432max_connections = 1000unix_socket_directory = '/var/run/postgresql'ssl = trueshared_buffers = 256MBvacuum_cost_delay = 20msdefault_statistics_target = 100log_destination = 'stderr'logging_collector = onlog_directory = '/var/log/postgresql'log_filename = 'postgresql-%Y-%m-%d_%H%M%S.log'log_truncate_on_rotation = onlog_rotation_age = 1dlog_rotation_size = 0MBlog_connections = onlog_disconnections = onlog_line_prefix = '<%t %u %h>'track_activities = ontrack_counts = ondatestyle = 'iso, mdy'lc_messages = 'en_US.UTF-8'lc_monetary = 'en_US.UTF-8'lc_numeric = 'en_US.UTF-8'lc_time = 'en_US.UTF-8'default_text_search_config = 'pg_catalog.english'I have read quite a bit over the last couple days and must be missing something as I cannot see why each connection is using so much memory.Thanks for any help you can provide!-Aaron==================================================================
Aaron Bono
Aranya Software Technologies, Inc.
http://www.aranya.com
http://codeelixir.com
==================================================================
