On 2024/01/31 5:20, Paul E. McKenney wrote:
[...]
>
> Except that github choked on the 366MB coe.out file. The gzip command
> compresses it to 72MB, and "tar -cJf" gets it down to 33MB, so maybe I
> rebase the compressed version into the commit that created that file.
Quote from github's file size limit at:
https://docs.github.com/en/repositories/working-with-files/managing-large-files/about-large-files-on-github#file-size-limits
GitHub limits the size of files allowed in repositories. If you
attempt to add or update a file that is larger than 50 MiB, you
will receive a warning from Git. The changes will still
successfully push to your repository, but you can consider removing
the commit to minimize performance impact. For more information,
see "Removing files from a repository's history."
...
GitHub blocks files larger than 100 MiB.
You hit the github's limit.
>
> And change the script that collects the data to do the compression. ;-)
>
> Now kernel.org had no problem with the full file, but it might also
> be good to avoid imposing too much on their storage-space largesse...
>
> Other thoughts?
Well, no. Using xz compression looks reasonable to me.
By the way, you added the following in the answer to QQA 15.31:
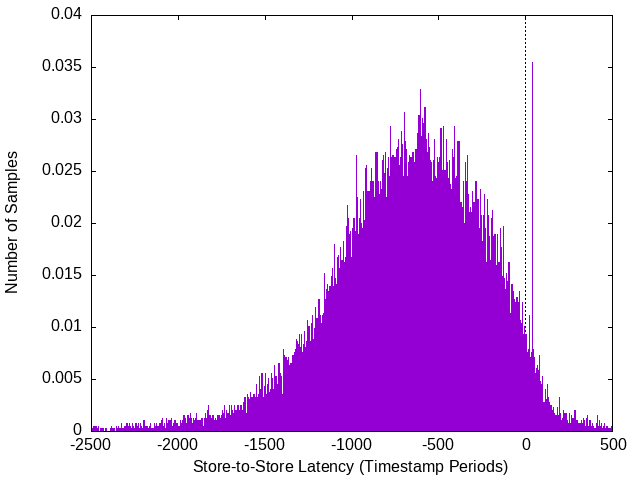
Alert readers may have noticed that the distribution shown in
Figure E.10 is monomodal, which those in Figure E.12 and
Figure E.14 are trimodal.
In coe.png, whose bin_width is 2 I think, I see a spike around
time period = [38, 40]. Count of time period 40 is 140 and the
largest count in coe.dat.
Attached coe.png is the histogram version of the same plot.
The spike is more evident there.
This spike causes slight but significant enough bump in the
right shoulder of Figure E.10 whose bin_width is 40.
You can still say the distribution is monomodal, but I just
wanted to make sure.
Or I can replace the EPS plot with the one with bin_width=2,
if you prefer.
Thanks, AkiraAttachment:
coe-hist.png
Description: PNG image
