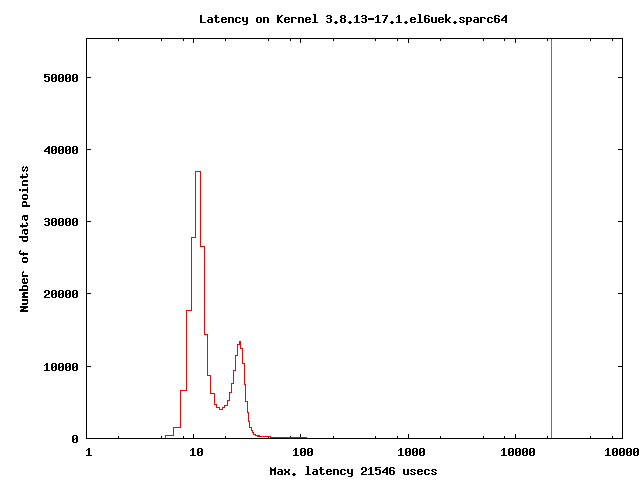
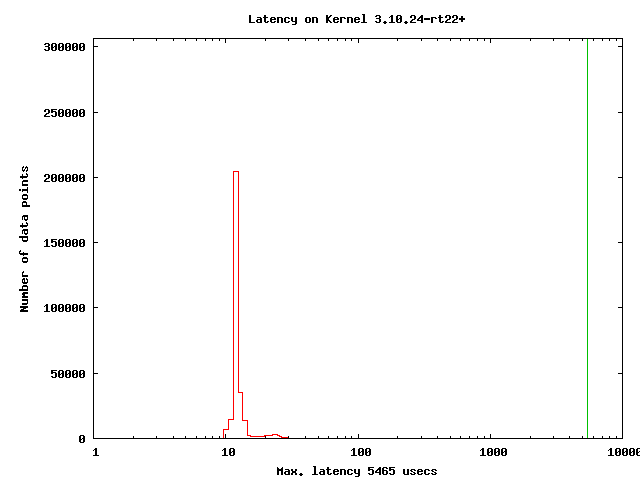
Sebastian,
>
> This is the stack where the NMI got injected. Not sure why this is more
> than once here but then this the sparc64 trace I see :)
>
>> [ 1150.135604]  [00000000004acc00] in_lock_functions+0x0/0x40
>> [ 1150.135608]  [000000000080a038] add_preempt_count+0xd8/0x140
>> [ 1150.135610]  [000000000080617c] __schedule+0x1c/0x500
>> [ 1150.135613]  [0000000000806b7c] schedule+0x1c/0xc0
>> [ 1150.135615]  [0000000000806f8c] schedule_preempt_disabled+0xc/0x40
>> [ 1150.135617]  [000000000049dd10] cpu_startup_entry+0x150/0x300
>
> And this where the CPU was before the NMI. Doesn't look blocking.
> in_lock_functions() compares a few values no locking involved so the CPU
> probably was here while the NMI hit and an usec later it might be an
> instruction later. What I thnig is odd, is that it is exactly at the
> begin of the function, not an instruction later.
>

I haven't made much progress yet. These appear when the machine is under
stress(hackbench/dd). There's also another issue that popped up while
I ran hack bench, here's the brief trace

[ 6694.884398] kernel BUG at kernel/rtmutex.c:738!
[ 6694.884402]               \|/ ____ \|/
[ 6694.884402]               "@'/ .. \`@"
[ 6694.884402]               /_| \__/ |_\
[ 6694.884402]                  \__U_/
[ 6694.884403] hackbench(18821): Kernel bad sw trap 5 [#2]
[ 6694.884408] CPU: 8 PID: 18821 Comm: hackbench Tainted: G      D W    3.10.24-rt22+ #11
[ 6694.884410] task: fffff80f8f4a2580 ti: fffff80f8ebd4000 task.ti: fffff80f8ebd4000
[ 6694.884413] TSTATE: 0000004411001603 TPC: 0000000000878ec4 TNPC: 0000000000878ec8 Y: 00000000    Tainted: G      D W
[ 6694.884425] TPC: <rt_spin_lock_slowlock+0x304/0x340>
[ 6694.884427] g0: 0000000000000000 g1: 0000000000000000 g2: 0000000000000000 g3: 0000000000de5800
[ 6694.884429] g4: fffff80f8f4a2580 g5: fffff80fd089c000 g6: fffff80f8ebd4000 g7: 726e656c2f72746d
[ 6694.884430] o0: 00000000009bfaf0 o1: 00000000000002e2 o2: 0000000000000000 o3: 0000000000000001
[ 6694.884432] o4: 0000000000000002 o5: 0000000000000000 sp: fffff80fff9b70d1 ret_pc: 0000000000878ebc
[ 6694.884434] RPC: <rt_spin_lock_slowlock+0x2fc/0x340>
[ 6694.884437] l0: fffff80fff9b7990 l1: fffff80f8f4a2580 l2: fffff80f8f4a2bd0 l3: 000001001fb75040
[ 6694.884438] l4: 0000000000000000 l5: 0000000000e25c00 l6: 0000000000000008 l7: 0000000000000008
[ 6694.884440] i0: fffff80f97836070 i1: 0000000000512400 i2: 0000000000000001 i3: 0000000000000000
[ 6694.884441] i4: 0000000000000002 i5: 0000000000000000 i6: fffff80fff9b7211 i7: 00000000008790ac
[ 6694.884444] I7: <rt_spin_lock+0xc/0x40>
[ 6694.884445] Call Trace:
[ 6694.884448]  [00000000008790ac] rt_spin_lock+0xc/0x40
[ 6694.884454]  [000000000052e30c] unmap_single_vma+0x1ec/0x6c0
[ 6694.884456]  [000000000052e808] unmap_vmas+0x28/0x60
[ 6694.884459]  [0000000000530cc8] exit_mmap+0x88/0x160
[ 6694.884465]  [000000000045e0d4] mmput+0x34/0xe0
[ 6694.884469]  [00000000004669fc] do_exit+0x1fc/0xa40
[ 6694.884473]  [000000000087a650] perfctr_irq+0x3d0/0x420
[ 6694.884477]  [00000000004209f4] tl0_irq15+0x14/0x20
[ 6694.884482]  [0000000000671e4c] do_raw_spin_lock+0xac/0x120
[ 6694.884485]  [0000000000879cc8] _raw_spin_lock_irqsave+0x68/0xa0
[ 6694.884488]  [0000000000452074] flush_tsb_user+0x14/0x120
[ 6694.884490]  [00000000004515a8] flush_tlb_pending+0x68/0xe0
[ 6694.884492]  [0000000000451800] tlb_batch_add+0x1e0/0x200
[ 6694.884496]  [000000000053bef8] ptep_clear_flush+0x38/0x60
[ 6694.884498]  [000000000052a9fc] do_wp_page+0x1dc/0x860
[ 6694.884500]  [000000000052b3f8] handle_pte_fault+0x378/0x7c0

These are the two issues I have ran into with stress. Otherwise the machine is quite stable
with light load(compress/decompress and building the kernel).

Attached are the graphs of the system on light load.

Thanks,

Allen
Attachment:
plot_OL.png
Description: PNG image
Attachment:
plot_RT.png
Description: PNG image
