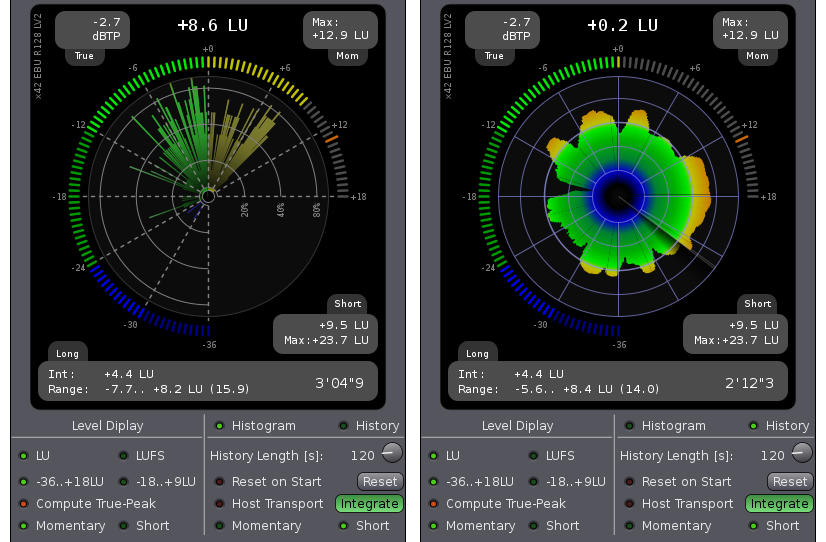
On 08/05/2014 02:37 PM, Raffaele Morelli wrote:
> Hi,
>
> is there any linux tool which can produce plots like this?
> http://i46.tinypic.com/351iyqq.jpg
>

Not a plot exactly like the linked one, but the same information on a
circle can be produced live with meters.lv2. See the left image at
https://raw.githubusercontent.com/x42/meters.lv2/master/doc/LV2ebur128.png
for an example.

It uses Fons' ebur128 under the hood which he already explained.

You can get it from https://github.com/x42/meters.lv2 which is also
available on most GNU/Linux distributions part of the x42-plugins package.

Cheers!
robin
_______________________________________________
Linux-audio-user mailing list
Linux-audio-user@xxxxxxxxxxxxxxxxxxxx
http://lists.linuxaudio.org/listinfo/linux-audio-user
