I hope I'm doing this the right way.
I "just" want to file a bug report.
The bugreport-website (https://wiki.documentfoundation.org/QA/BugReport) refers to this mailing-list website (https://wiki.documentfoundation.org/Development/Mailing_List),
but the mailing-list website states "Do not mail to the list for: Reporting bugs ... Reporting bugs is explained here: BugReport" and refers back to the bugreport-website.
I've first put the topic for discussion on the German LibreOffice forum (https://www.libreoffice-forum.de/viewtopic.php?f=6&t=40478),
and the received feedback / recommendation was to place a bugreport.
At the link, you can also find a example file for illustrating the problem.
Since I'm using the German localized version, please don't get offended if my translation to English is a bit lopsided.
1) My system
Ubuntu LTS24.04
Libre Office - Calc - Version 24.2.7.2 (X86_64)
localization: German
2) What I want to achieve
Having a diagram plotting several (more than one) datalines.
Each dataline ist a list of several datasets (x-values, y-values, description).
The diagram should show for each dataline and each dataset (aka each x/y-point) the corresponding description.
3) What I've done - step by step
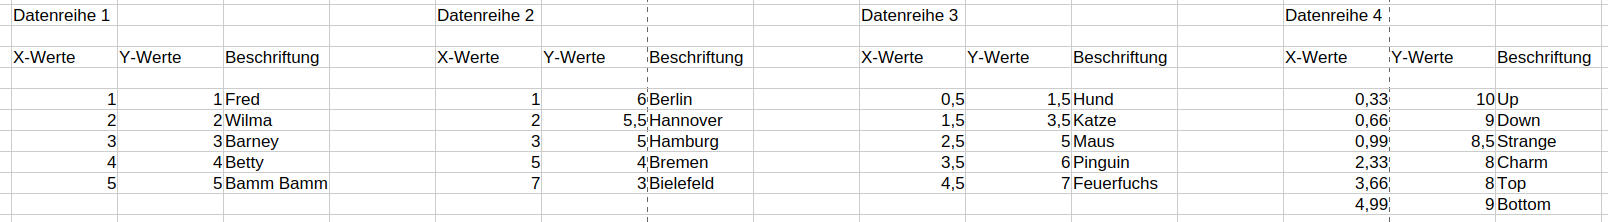
enter the data to the cells in the calc sheet: e.g. data for four datalines
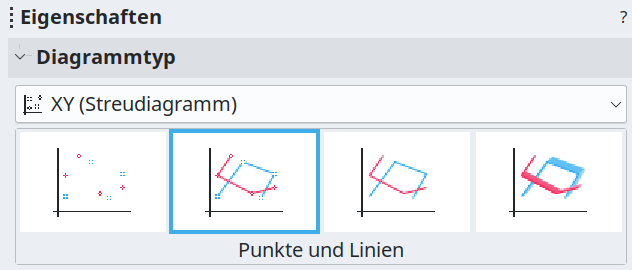
create a diagram (a plot?) of the type x/y-scatter subtype dots-connected-with-lines
at data source, pressing the "add" button four times to create 4 datalines
for each of these 4 data lines:
select the button dataline/name and fill the field with the cell-index of the cell containing the dataline-name, using the select-by-mouse button
select the button dataline/x-values and fill the field with the cell-indices of the cells containing the list of x-values, using the select-by-mouse button
select the button dataline/y-values and fill the field with the cell-indices of the cells containing the list of y-values, using the select-by-mouse button
fill the field called "data-description" with the cell-indices of the cells containing the list of descriptions, using the select-by-mouse button
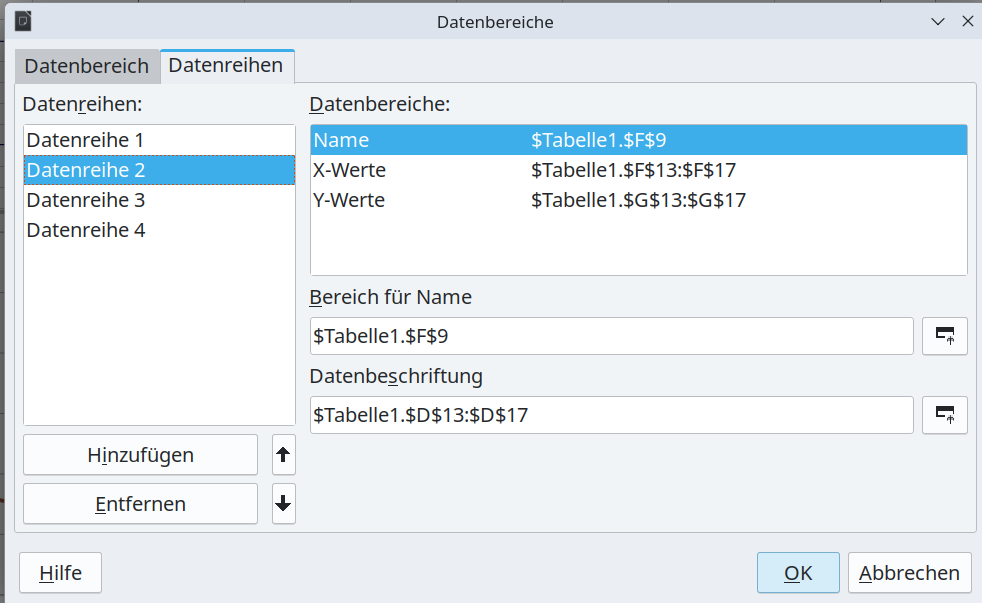
What I noticed:
Each dataline has its individual name, x-values, y-values
But the data-description applies to all datalines together, it is NOT individual for each dataline.
If I e.g. enter cell-indices data to the data-description field for dataline 2, it is applied to all four data lines.
At the diagram by selecting (right mouse clicking) each of the 4 displayed data lines:
enable the show-description option
mouse rightclicking one of the shown descriptions (numbers)
select button "edit data description" and sub-button "data description"
default enabled is the option "value as number"
disable this option
enable the "category" option
result:
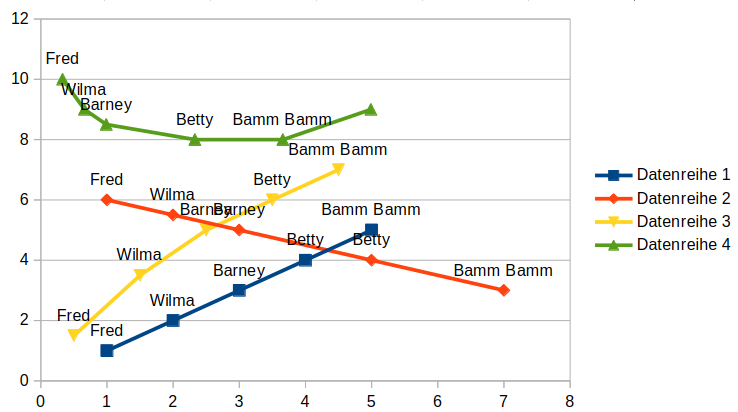
only one of the four datalines can get the correct dot descriptions,
all other datalines just show the same descriptions which are wrong for them
4) my opinion
IMHO, the data-description field should be individual for each data line,
so that different datalines can have different descriptions.
With Best Regards,
Michael
