Hi,
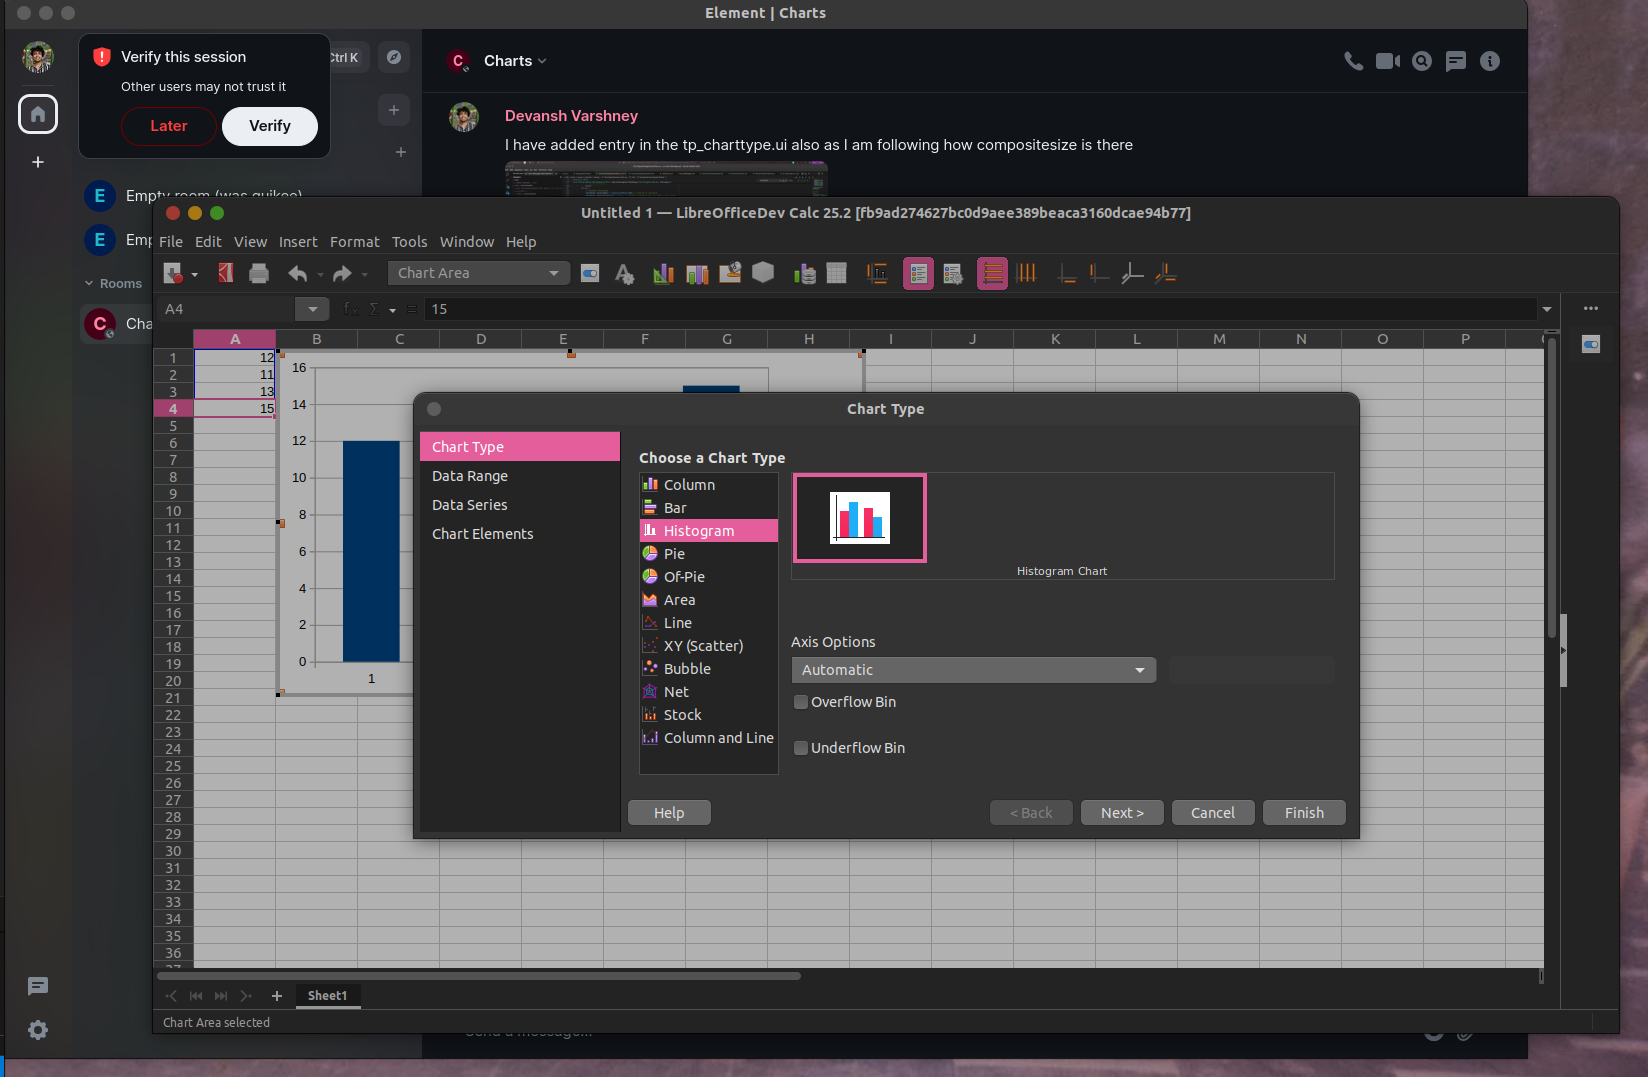
The axis option like the MSO-2016 and onwards is now visible in the Chart Type dialog in the Side Bar Type of the UI selection for the charts.(as seen in the image)
Here is a video of this working - https://www.youtube.com/watch?v=_H-eWhnQm-g
We already had entries for these custom options in the IDL file, but I have refined a little the FrequencyType -
service HistogramDiagram
{
service com::sun::star::chart::Diagram;
service com::sun::star::chart::ChartStatistics;
service com::sun::star::chart::ChartAxisXSupplier;
service com::sun::star::chart::ChartTwoAxisYSupplier;
/** Specifies the number of bins in the histogram. */
[property] long BinCount;
/** Specifies the range of values covered by the bins. */
[property] string BinRange;
/** Specifies the width of each bin in the histogram. */
[property] double BinWidth;
/**
* Specifies the type of frequency representation.
* 0: Automatic
* 1: Bin Width
* 2: Number of bins (BinCount)
* 3: By Category
*/
[property] short FrequencyType;
/** Specifies whether to include an overflow bin. */
[property, optional] boolean OverflowBin;
/** Specifies whether to include an underflow bin. */
[property, optional] boolean UnderflowBin;
};
}; }; }; };
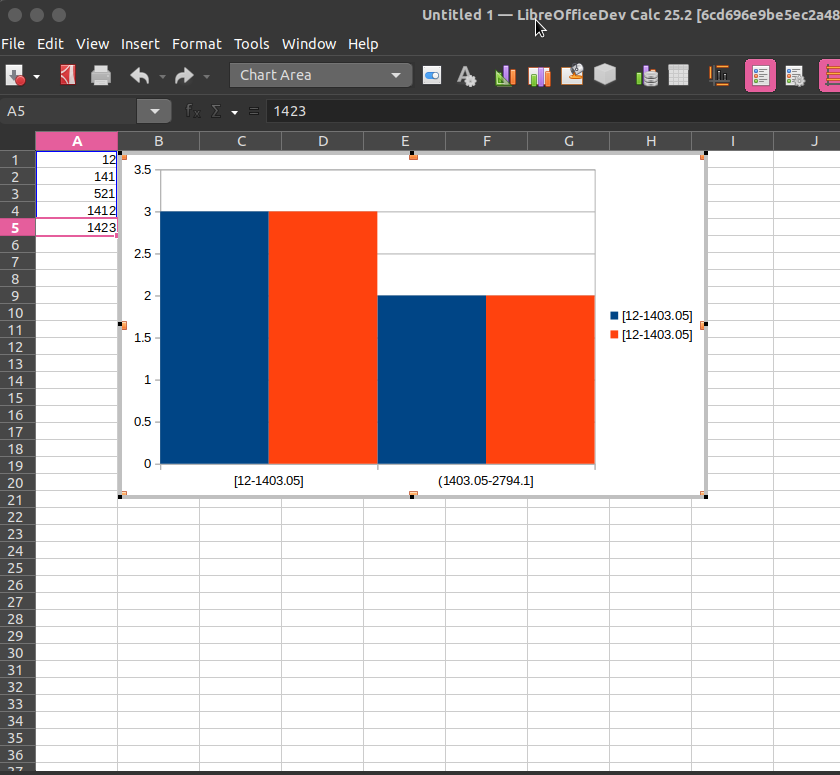
We have to make sure that the Histogram calculation takes these custom values and correctly calculates the bars.
Currently, upon selecting any of the options, this is what we are getting -
--
Regards,
Devansh
