Hi,
So last week my mentor Tomaž set the direction of the descent towards a working Histogram which is now successfully merged with master https://gerrit.libreoffice.org/c/core/+/167068
As I kept looking to modify the View for the Histogram which was quite late to do so and hence he set up two file HistogramDataSequence and HistogramDataInterpreter as the name suggests handling sequence of data and interpreting it in separate logic.
and as I used square root to calculate the number of bins which was easier to test with(for me) which was later pointed out that we should be using what MS-Office is using and my mentor pointed me https://support.microsoft.com/en-us/office/create-a-histogram-85680173-064b-4024-b39d-80f17ff2f4e8#ID0EBBDBBJBJ-panel Scott’s normal reference (By Default) and as off now I do have created a separate commit for this which I corrected/aligned over the last week- https://gerrit.libreoffice.org/c/core/+/170526
We are still not having the exact same values as in the MS-Office ones, which still needs some calculation(rounding/approximation) corrections.
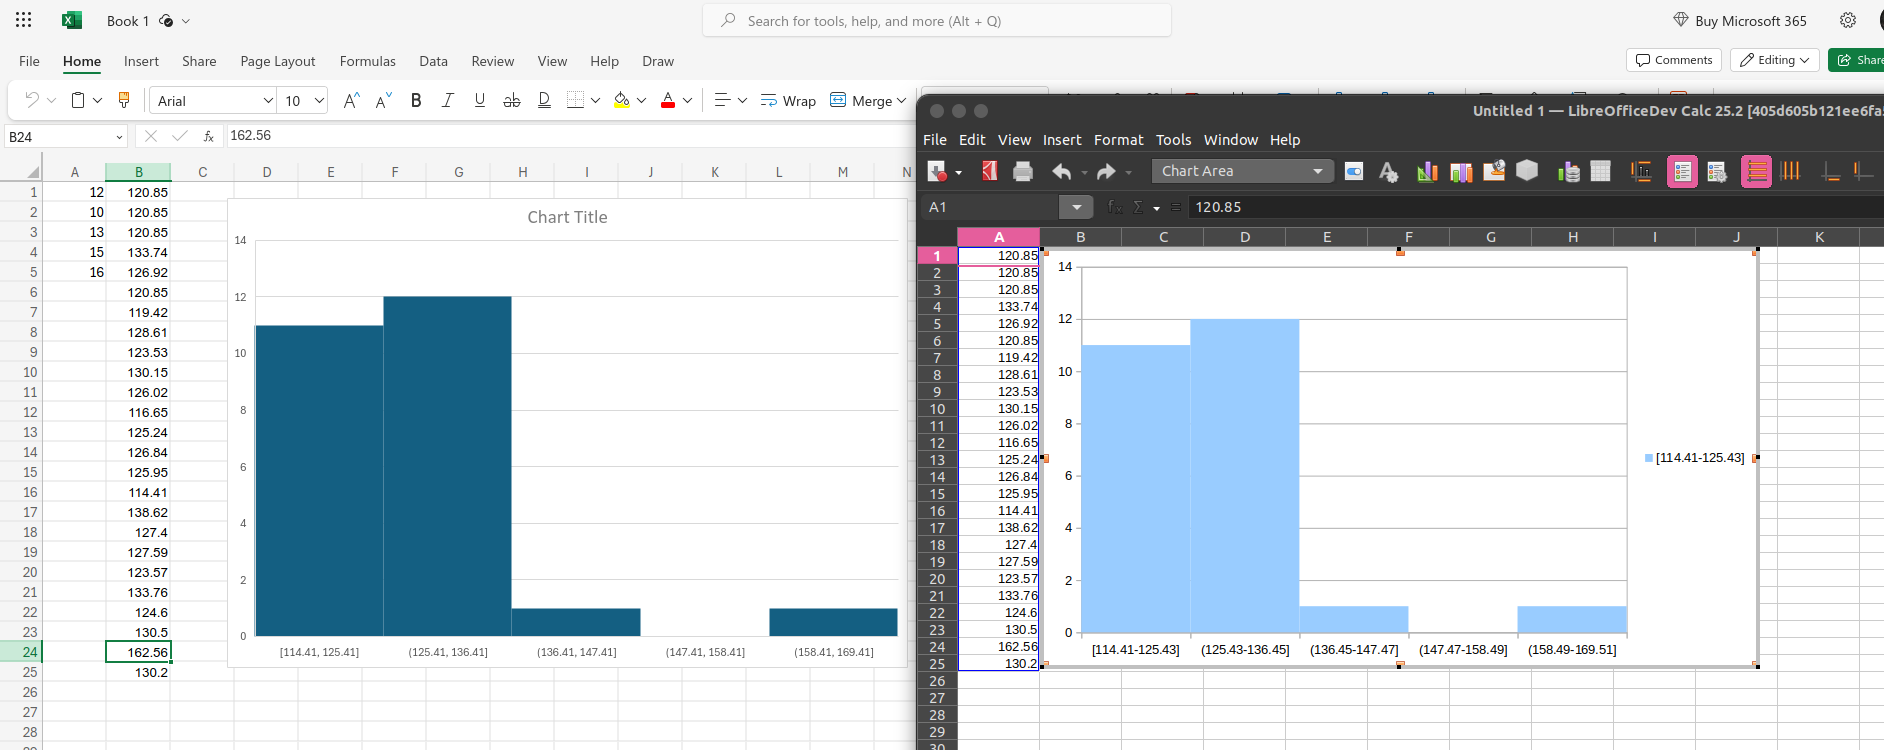
MS-Office vs. Our Implementation -
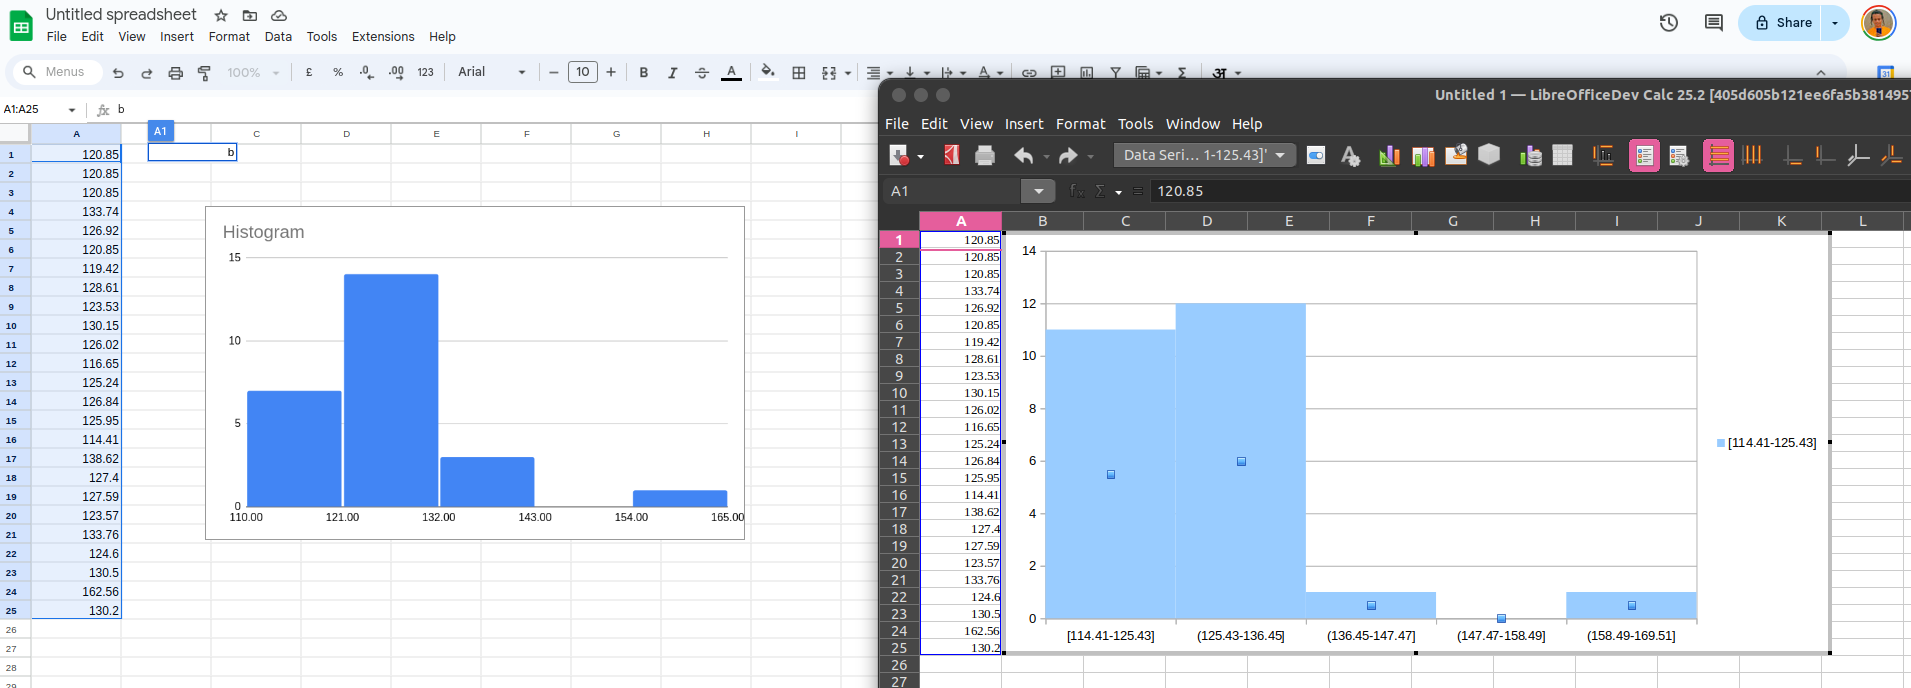
Google Sheet vs. Our Implementation -
There is a blog about Hisotgram and its working by MSO http://web.archive.org/web/20160117042913/https://blogs.office.com/2015/08/18/visualize-statistics-with-histogram-pareto-and-box-and-whisker-charts/
Second, I also made a mistake in how we perceive/begin the bin range?
I believed that creating Bin Ranges was similar to filling a glass with water, wherein we begin by including the beginning(base) until below the top(to avoid overflow), akin to filling a glass of water.
i.e. [Glass of Water)
But, this is not how MS-Office is doing rather it was (Glass of Water] & can be seen in the above imageries. Hence, made change to the code -
// Set up bin ranges
maBinRanges.reserve(mnBins);
double fBinStart = fMinValue;
for (sal_Int32 i = 0; i < mnBins; ++i)
{
double fBinEnd = fBinStart + mfBinWidth;
// Correct rounding to avoid discrepancies
fBinStart = std::round(fBinStart * 100.0) / 100.0;
fBinEnd = std::round(fBinEnd * 100.0) / 100.0;
if (i == 0)
{
// First bin includes the minimum value, so use closed interval [fMinValue, fBinEnd]
maBinRanges.emplace_back(fMinValue, fBinEnd);
}
else
{
// Subsequent bins use half-open interval (fBinStart, fBinEnd]
maBinRanges.emplace_back(fBinStart, fBinEnd);
}
fBinStart = fBinEnd;
}
// Create labels and values for HistogramDataSequence
std::vector<OUString> labels;
std::vector<double> values;
for (size_t i = 0; i < binRanges.size(); ++i)
{
OUString label;
if (i == 0)
{
label = u"[" + OUString::number(binRanges[i].first) + u"-"
+ OUString::number(binRanges[i].second) + u"]";
}
else
{
label = u"(" + OUString::number(binRanges[i].first) + u"-"
+ OUString::number(binRanges[i].second) + u"]";
}
labels.push_back(label);
values.push_back(static_cast<double>(binFrequencies[i]));
}
i.e. A data point is included in a particular bin if the number is greater
than the lowest bound and equal to or less than the greatest bound for
the data bin.
Now, these above two changes are still needs to be added /merge to replace the square root method.
There is one more thing which can be seen easily is the color of the bins in our implementation and which is also being pointed out by Stéphane in the testing https://bugs.documentfoundation.org/show_bug.cgi?id=162135
Me and my mentor, we both did have a conversation on this that this is probably due to as we are creating a new DataSeries instead of reusing the existing one. For example, since we are inheriting BarChart view to reuse the code for creating and rendering the bars.
void HistogramChart::createShapes()
{
if (m_aZSlots.empty()) //No data series Available
return;
OSL_ENSURE(
m_xLogicTarget.is() && m_xFinalTarget.is(),
"HistogramChart is not properly initialized"); // Ensuring chart is properly initialized
if (!(m_xLogicTarget.is() && m_xFinalTarget.is()))
return;
adaptGapWidthForHistogram();
BarChart::createShapes();
}
Have to discuss this and also looking for more feedback as New histogram chart implemented in 25.2 by 07ae0e5ada7cb595eb4815413a5bdd442c32a6ab for bug 82716
For this week which is 11 My goal is to get the OOXML and ODF support added for the histogram http://officeopenxml.com/
The way I have understood OOXMl and ODF as sort of Container File (which could be thought of zip file) since we are using XML files for reading parsing and loading the struture how it should look on the UI or presented to the user.
The every first time I came across this kind of usage of XML when I was making a small software using Qt ( https://github.com/varshneydevansh/EFM-DC_V2 ) where for the UI I came across the usage of XML file.
So, for this if I am correct is had to make the Histogram correctly able to read and write its content in XML files so that we can use it efficiently.
OOXML - Microsoft Office applications like Excel (.xlsx), Word (.docx), and PowerPoint (.pptx). oox/source/ directory
ODF - Used by LibreOffice applications like Calc (.ods), Writer (.odt), and Impress (.odp). xmloff/source/chart/ directory
How Do Import and Export Work?
Importing (Reading)
When we import an OOXML or ODF file:
- The software unzips the archive.
- It reads the XML files inside.
- It parses the XML data to understand the content and structure (e.g., charts, tables, text).
- It loads this data into the application (like LibreOffice Calc or Excel) for us to work with.
Exporting (Saving)
When we export to an OOXML or ODF file:
- The software gathers the data from the application.
- It formats this data into XML according to the OOXML or ODF standards.
- It creates new XML files or updates existing ones inside the archive.
- It zips the files into a single archive (e.g., .xlsx or .ods).
Not just this also have to look at the testing results a.k.a the bugs which are now being reported.
and soon work for the Pareto Chart :)
From: Devansh Varshney <varshney.devansh614@xxxxxxxxx>
Date: Thu, 11 Jul 2024 at 00:30
Subject: GSoC: Adding Histogram Chart Native Support (Week 8, prev) and (Week 9, this)
To: <libreoffice@xxxxxxxxxxxxxxxxxxxxx>Hi,So, the previous week I did not send the weekly update as I was hopeful that I am close to get this doneand kept pushing to not only get the X and Y axis with proper Bin Range and Frequency but also the barfor the Histogram plot. But, I also find the scaling issue which I encountered by the end of the week.Here, I am using the analogy of Gradient Descent part of Mathematical Optimization to explain the situation.In the beginning of the May, we started off from the top region (Red) with the highest cost of instability forthe addition of the changes. By the end of May we were able to have the Histogram specific code but mimickingBar/Column Chart and in the beginning of the June we were able to have the bars attached to each other,i.e., with ZERO gap between each other.![Screenshot from 2024-06-13 21-38-21.png]() After having this as a success, we went on our next step, which was to get the X and Y axis as Bin Ranges and Frequency.Which could be thought of as somewhere around the location of Saddle point. From here instead of going towards theglobal minima I went towards the local minima, which is got stuck with the axes' modification.Though in local minima which took me almost 4 weeks I kept revolving into it and the result was by last week -
After having this as a success, we went on our next step, which was to get the X and Y axis as Bin Ranges and Frequency.Which could be thought of as somewhere around the location of Saddle point. From here instead of going towards theglobal minima I went towards the local minima, which is got stuck with the axes' modification.Though in local minima which took me almost 4 weeks I kept revolving into it and the result was by last week -![Screenshot from 2024-07-06 19-47-52.png]() ```bashi/p- 12,10,15,16,14o/p -Entering createShapes()
```bashi/p- 12,10,15,16,14o/p -Entering createShapes()
xSeriesTarget is valid: true
xTextTarget is valid: true
m_nBins: 2, m_fBinWidth: 3
minValue: 10, maxValue: 16
m_binRanges: {10, 13} {13, 16}
m_binFrequencies: 3 2
Bin ranges size: 2
Bin frequencies size: 2
Entering doXSlot() for bin index: 0
Bar dimensions - X: 0.25, Width: 0.5, Height: 1
Exiting doXSlot()
Entering doXSlot() for bin index: 1
Bar dimensions - X: 0.75, Width: 0.5, Height: 0.666667
Exiting doXSlot()
Exiting createShapes(```I was able to have the bars which were 2 as I am using the sqrt method to calculate the number of bins as of now.After having been stuck in the local minima for so long, my mentor Tomaž came forward and change the direction of thedescent from the local minima towards the global minima by creating the chart2/source/model/template/HistogramDataInterpreter.cxxand chart2/source/tools/HistogramDataSequence.cxx where we are currently having the X and Y axis values and dummy valuesHard-coded -![Screenshot from 2024-07-08 18-20-06.png]() In the above images which were being generated via the help of HistogramDataInterpreter the first image is taking the BarChartas the base hence bars with gaps -chart2/source/view/charttypes/VSeriesPlotter.cxx -```cppelse if( aChartType.equalsIgnoreAsciiCase( CHART2_SERVICE_NAME_CHARTTYPE_HISTOGRAM ) )
In the above images which were being generated via the help of HistogramDataInterpreter the first image is taking the BarChartas the base hence bars with gaps -chart2/source/view/charttypes/VSeriesPlotter.cxx -```cppelse if( aChartType.equalsIgnoreAsciiCase( CHART2_SERVICE_NAME_CHARTTYPE_HISTOGRAM ) )
pRet = new BarChart(xChartTypeModel, nDimensionCount);```and the next image is where I after cherry-picking the code and replacing the base object as Histogram.aNewData.push_back(aData[0]);{rtl::Reference<HistogramDataSequence> aValuesDataSequence = new HistogramDataSequence();aValuesDataSequence->setValues({ 7, 12, 4, 6 });aValuesDataSequence->setLabels({ u"[1-4)"_ustr, u"[4-8)"_ustr, u"[8-12)"_ustr, u"[12-16]"_ustr });aDataSequence = aValuesDataSequence;SetRole(aDataSequence, u"values-y"_ustr);aNewData.push_back(new LabeledDataSequence(aDataSequence));}After this Tomaž pointed out some other changes which are better for the descent, which included the change of inheritancefrom VSeriesPlotter and ChartModel to BarChart. The reason being is as Histogram is sort of a special Barchart we can reuselot of code from Barchart itself and if you look closely in the code you can find that the ColumnChart and Barchart are utilizing a lotof code to avoid more redundancy of code -pPosHelper->isSwapXAndY()since they are same with only difference of axis difference.The second is to detach the Bin and Frequency calculation to a separate class from the HistogramChartType model.to which we can find an appropriate place later.I have done this and named the class as - chart2/source/model/template/HistogramCalculator.hxxThird is replacing the hard-coded values with the input, i.e., dynamic calculation of the values.Currently, in order to align with the first point, I am reverting my addition of the HistogramPositionHelper withBarPositionHelper and having some -```bashError: attempt to subscript container with out-of-bounds index 2, but
container only holds 2 elements.```As of now, I am considering to get the dynamic calculations first and later update the inheritance. Hence, currently at thesmall red region in between local and global minima, hence the instability with the codeafter the intervention and better descent approach made by Tomaž it now won't take that much time now.what we thought how our work gonna be
how it's actually goingTill last week, I couldn't figure out why I got stuck this bad. But now it makes sense from the view point of mathematics. :)
Regards,
Devansh
