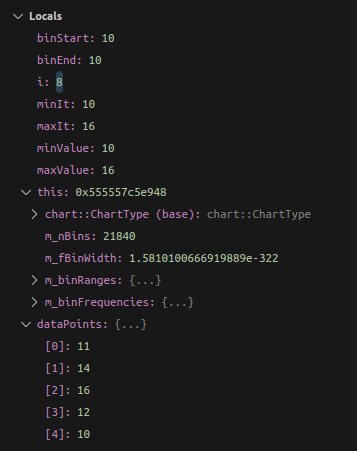
So for this week I have been able to align the Bin and Frequency calculation for the Histogram correct.
Since, past week it was getting often garbage values or sometime not properly retaining calculated values.
Example screenshot of some miscalculations -
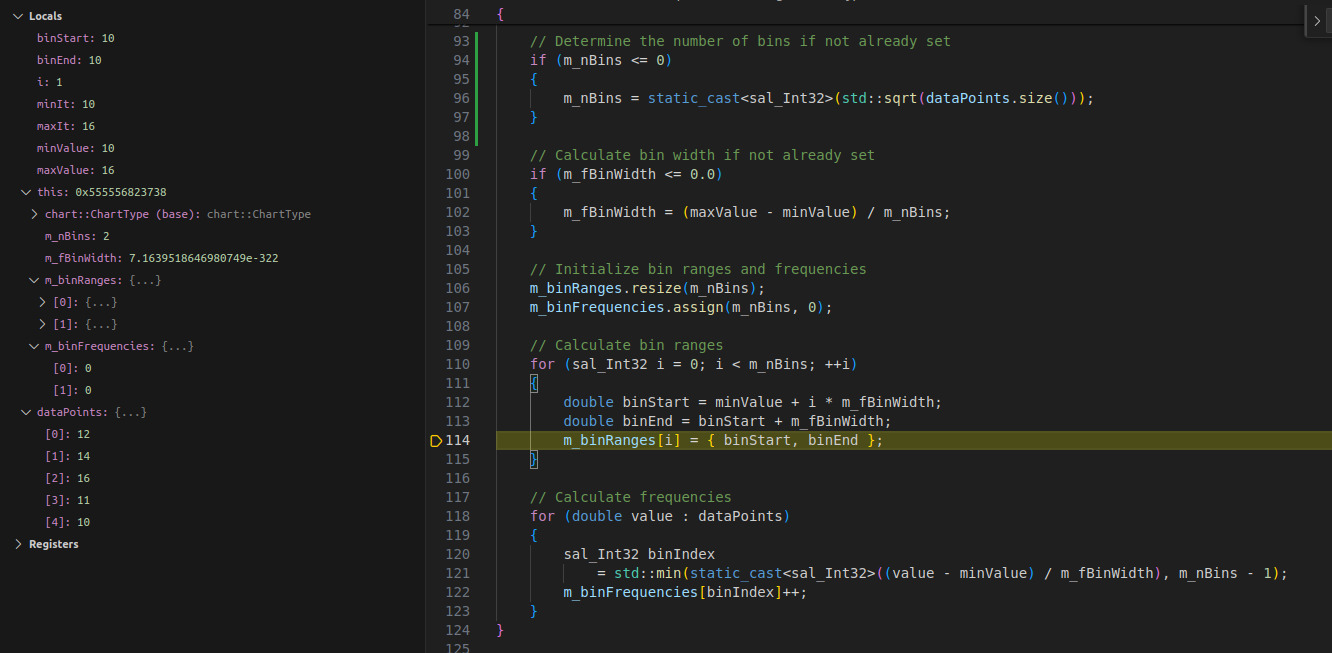

After adjusting the
void HistogramChartType::computeBinFrequencyHistogram(const std::vector<double>& dataPoints)
the variables and calculations are safe.
for example like this -
//round min and max to 6 decimal places
minValue = std::round(minValue * 1e6) / 1e6;
maxValue = std::round(maxValue * 1e6) / 1e6;
// Handle the case where all values are the same
if (minValue == maxValue)
{
m_nBins = 1;
m_fBinWidth = 1.0;
m_binRanges = { { minValue, minValue + 1.0 } };
m_binFrequencies = { static_cast<sal_Int32>(dataPoints.size()) };
return;
}
m_nBins = static_cast<sal_Int32>(std::sqrt(dataPoints.size()));
//calculate bin width, ensuring it's not zero and rounding to 6 decimal places
m_fBinWidth = std::round((maxValue - minValue) / m_nBins * 1e6) / 1e6;
if (m_fBinWidth <= 0)
{
m_fBinWidth = 0.000001; // Minimum bin width of 0.000001
m_nBins = static_cast<sal_Int32>(std::ceil((maxValue - minValue) / m_fBinWidth));
}
Currently, I am calculating the Bins with the square root method (there are more ways to do this) -
m_nBins = static_cast<sal_Int32>(std::sqrt(dataPoints.size()));
terminal output while LO development is running and selecting the Histogram Chart from the UI -
```bash
[~/libreoffice]
devansh histogram_support -+ instdir/program/scalc [24/06/26| 10:09PM]
warn:vcl.schedule:173007:173007:vcl/source/app/scheduler.cxx:639: Stop the task before changing the priority, as it will just change after the task was scheduled with the old prio!
warn:chart2:173007:173007:chart2/source/controller/main/ControllerCommandDispatch.cxx:723: commandAvailable: command not in availability map:.uno:StatusBarVisible
warn:chart2:173007:173007:chart2/source/controller/main/ControllerCommandDispatch.cxx:723: commandAvailable: command not in availability map:.uno:StatusBarVisible
warn:chart2:173007:173007:chart2/source/controller/main/ControllerCommandDispatch.cxx:723: commandAvailable: command not in availability map:.uno:StatusBarVisible
m_nBins: 2, m_fBinWidth: 3
minValue: 10, maxValue: 16
m_binRanges: {10, 13} {13, 16}
m_binFrequencies: 3 2
```
As you can see the calculations are seem to be correct, while to make sure these changes for the computeBinFrequencyHistogram I got stuck with some R-B tree related error for the debugger in the VS Code. But, it got sorted out, all I did was a couple of restarts and adding the new patches from the master. ;)
But, the elephant in the room the X and Y axis conversion to the bin and frequency is still not complete. I have cluttered a lot of code from the doZSlot and doXSlot which was related to the 3D and specifically to the Bars/Columns and made changes to the logic to adapt for the processing of the bins and frequency, but still seems like it needs more careful considerations.
But, over the UI the bars are now NOT being drawn, so I am looking into this.
--
Regards,
Devansh
