Hi,
So, the previous week I made the update regarding the chart bars not looking like the Histogram and unable to get the X and Y axis to align with the Bin and Frequency respectively.
This week, my mentor Tomaz asked me if there is any trouble I am experiencing. I then asked him if I am unable to get the bars aligned with how the Histogram bars seem visible. He immediately found my mistake, which was a little typo -
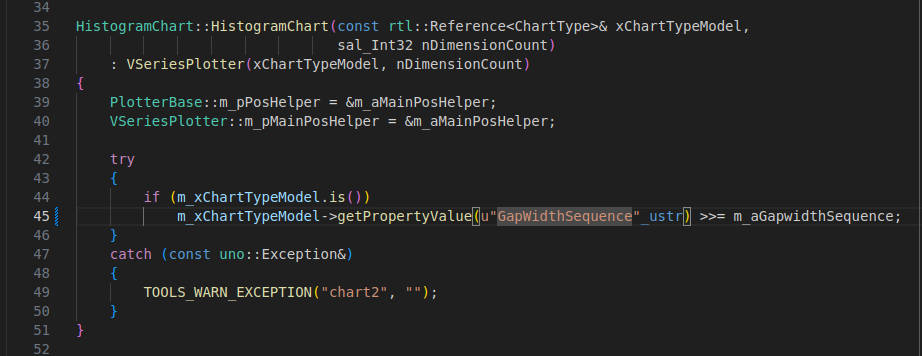
with the small case of W for the word Width.
GapwidthSequence
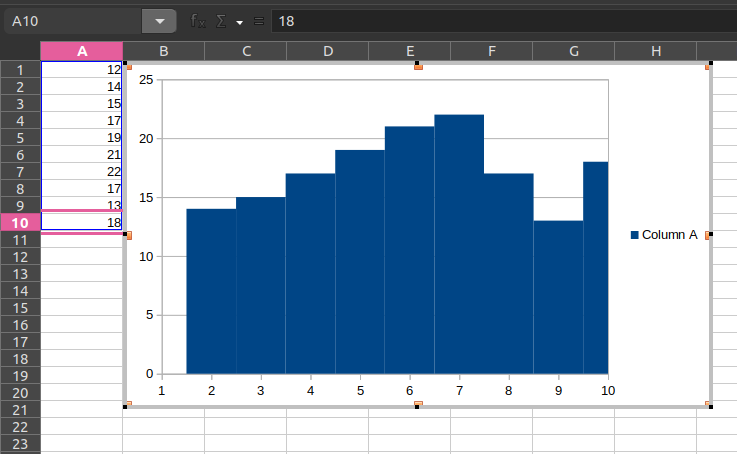
and now the chart resembles what a histogram looks like -
But, still the conversion of X and Y axis to the Bin and Frequency I made some changes' day before yesterday which I have stashed them(ATTACHED FILE) as they first do not show the bars which was the main thing. Second, I think these are not the right changes which we intend to need. So, I reverted and stashed them.
What I am doing is now calculating the bins first, then aggregating data points in bin.
Then drawing bars using modified doZSlot and doXSlot methods, maintaining the original structure while adapting the logic for histogram requirements. Which I did in the stash but feels like not properly.
Devansh Varshney varshney.devansh614@xxxxxxxxx
Hi,
I didn't post the update for weeks 3 and 4 as I have been working on eliminating the gaps between histogram bars that were visible in week 2 on the UI. This is something I have been wrapping my head around. I was tempted to get it done, but didn't realize it would take a while.
After discussing with my mentor Tomaz, He explained to me how the zSlot is being used, and I made changes to the
m_aZSlotsvariable. This variable is crucial for managing the layering of different data series along the Z-axis in our charting framework. However, since a histogram typically deals with a single series of data to create a frequency distribution, we can simplify this by always using the zero index of m_aZSlots.void HistogramChart::adaptGapwidthForHistogram(){VDataSeries* pFirstSeries = getFirstSeries();if (!pFirstSeries)return;sal_Int32 nAxisIndex = pFirstSeries->getAttachedAxisIndex();sal_Int32 nUseThisIndex = nAxisIndex;if (nUseThisIndex < 0 || nUseThisIndex >= m_aGapwidthSequence.getLength())nUseThisIndex = 0;auto aGapwidthSequenceRange = asNonConstRange(m_aGapwidthSequence);for (sal_Int32 nN = 0; nN < m_aGapwidthSequence.getLength(); nN++){aGapwidthSequenceRange[nN] = 0; // Set gap width to 0}}This is what I tried to add for the Gap based on the logic present in the BarChart.cxxNow, what he also helped me to understand what I should be focusing on first is to figure out the way how the X and Y axis can be changed to mimic the Bins and Frequency. Which I am working on.So, for these 2 weeks, I am thinking a way to make the X and Y axis working for the Histogram.
Regards,
Devansh
diff --git a/chart2/source/model/template/HistogramChartType.cxx b/chart2/source/model/template/HistogramChartType.cxx
index 97c6f9edb289..4244e79ca797 100644
--- a/chart2/source/model/template/HistogramChartType.cxx
+++ b/chart2/source/model/template/HistogramChartType.cxx
@@ -74,8 +74,9 @@ namespace chart
HistogramChartType::HistogramChartType()
: m_nBins(10) // Default number of bins
, m_fBinWidth(5.0) // Default bin width
- , m_binRanges() // Initialize empty
- , m_binFrequencies() // Initialize empty
+ , m_binRanges(m_nBins) // Initialize with bin count
+ , m_binFrequencies(m_nBins, 0) // Initialize with bin count and zero frequencies
+
{
}
@@ -83,49 +84,13 @@ HistogramChartType::HistogramChartType(const HistogramChartType& rOther)
: ChartType(rOther)
, m_nBins(10)
, m_fBinWidth(5.0)
- , m_binRanges()
- , m_binFrequencies()
+ , m_binRanges(m_nBins)
+ , m_binFrequencies(m_nBins, 0)
{
}
HistogramChartType::~HistogramChartType() {}
-// Helper method to calculate bins
-void HistogramChartType::calculateBins(const std::vector<double>& data)
-{
- if (data.empty())
- return;
-
- // Using std::min_element and std::max_element from the standard library
- double minVal = *std::min_element(data.begin(), data.end());
- double maxVal = *std::max_element(data.begin(), data.end());
-
- m_fBinWidth = (maxVal - minVal) / m_nBins;
-
- m_binRanges.clear();
- for (int i = 0; i < m_nBins; ++i)
- {
- m_binRanges.emplace_back(minVal + i * m_fBinWidth, minVal + (i + 1) * m_fBinWidth);
- }
-}
-
-// Helper method to count frequencies in bins
-void HistogramChartType::countFrequencies(const std::vector<double>& data)
-{
- m_binFrequencies.assign(m_binRanges.size(), 0);
- for (double value : data)
- {
- for (size_t i = 0; i < m_binRanges.size(); ++i)
- {
- if (value >= m_binRanges[i].first && value < m_binRanges[i].second)
- {
- m_binFrequencies[i]++;
- break;
- }
- }
- }
-}
-
// ____ XCloneable ____
uno::Reference<util::XCloneable> SAL_CALL HistogramChartType::createClone()
{
diff --git a/chart2/source/model/template/HistogramChartType.hxx b/chart2/source/model/template/HistogramChartType.hxx
index 1bd35385ab13..164b2f096f4b 100644
--- a/chart2/source/model/template/HistogramChartType.hxx
+++ b/chart2/source/model/template/HistogramChartType.hxx
@@ -24,6 +24,12 @@ public:
virtual rtl::Reference<ChartType> cloneChartType() const override;
+ // Accessors
+ sal_Int32 getNumBins() const { return m_nBins; }
+ double getBinWidth() const { return m_fBinWidth; }
+ const std::vector<std::pair<double, double>>& getBinRanges() const { return m_binRanges; }
+ const std::vector<int>& getBinFrequencies() const { return m_binFrequencies; }
+
protected:
explicit HistogramChartType(const HistogramChartType& rOther);
@@ -42,14 +48,6 @@ protected:
// ____ XCloneable ____
virtual css::uno::Reference<css::util::XCloneable> SAL_CALL createClone() override;
- // Methods for histogram calculations
- void calculateBins(const std::vector<double>& data);
- void countFrequencies(const std::vector<double>& data);
-
- // Accessors
- const std::vector<std::pair<double, double>>& getBinRanges() const { return m_binRanges; }
- const std::vector<int>& getBinFrequencies() const { return m_binFrequencies; }
-
private:
sal_Int32 m_nBins;
double m_fBinWidth;
diff --git a/chart2/source/view/charttypes/HistogramChart.cxx b/chart2/source/view/charttypes/HistogramChart.cxx
index 6800d2adf578..ce1caedb1a9d 100644
--- a/chart2/source/view/charttypes/HistogramChart.cxx
+++ b/chart2/source/view/charttypes/HistogramChart.cxx
@@ -42,7 +42,7 @@ HistogramChart::HistogramChart(const rtl::Reference<ChartType>& xChartTypeModel,
try
{
if (m_xChartTypeModel.is())
- m_xChartTypeModel->getPropertyValue(u"GapwidthSequence"_ustr) >>= m_aGapwidthSequence;
+ m_xChartTypeModel->getPropertyValue(u"GapWidthSequence"_ustr) >>= m_aGapwidthSequence;
}
catch (const uno::Exception&)
{
@@ -52,6 +52,85 @@ HistogramChart::HistogramChart(const rtl::Reference<ChartType>& xChartTypeModel,
HistogramChart::~HistogramChart() {}
+css::drawing::Direction3D HistogramChart::getPreferredDiagramAspectRatio() const
+{
+ // Return the preferred aspect ratio for the histogram chart
+ return css::drawing::Direction3D(-1, -1, -1);
+}
+
+PlottingPositionHelper& HistogramChart::getPlottingPositionHelper(sal_Int32 nAxisIndex) const
+{
+ PlottingPositionHelper& rPosHelper = VSeriesPlotter::getPlottingPositionHelper(nAxisIndex);
+ BarPositionHelper* pBarPosHelper = dynamic_cast<BarPositionHelper*>(&rPosHelper);
+ if (pBarPosHelper && nAxisIndex >= 0)
+ {
+ if (nAxisIndex < m_aGapwidthSequence.getLength())
+ pBarPosHelper->setOuterDistance(m_aGapwidthSequence[nAxisIndex] / 100.0);
+ }
+ return rPosHelper;
+}
+
+awt::Point HistogramChart::getLabelScreenPositionAndAlignment(
+ LabelAlignment& rAlignment, sal_Int32 nLabelPlacement, double fScaledX,
+ double fScaledLowerYValue, double fScaledUpperYValue, double fBaseValue,
+ BarPositionHelper const* pPosHelper) const
+{
+ double fY = fScaledUpperYValue;
+ bool bReverse = !pPosHelper->isMathematicalOrientationY();
+ bool bNormalOutside = (!bReverse == (fBaseValue < fScaledUpperYValue));
+
+ switch (nLabelPlacement)
+ {
+ case css::chart::DataLabelPlacement::TOP:
+ fY = bReverse ? fScaledLowerYValue : fScaledUpperYValue;
+ rAlignment = LABEL_ALIGN_TOP;
+ break;
+ case css::chart::DataLabelPlacement::BOTTOM:
+ fY = bReverse ? fScaledUpperYValue : fScaledLowerYValue;
+ rAlignment = LABEL_ALIGN_BOTTOM;
+ break;
+ case css::chart::DataLabelPlacement::OUTSIDE:
+ fY = (fBaseValue < fScaledUpperYValue) ? fScaledUpperYValue : fScaledLowerYValue;
+ rAlignment = bNormalOutside ? LABEL_ALIGN_TOP : LABEL_ALIGN_BOTTOM;
+ break;
+ case css::chart::DataLabelPlacement::INSIDE:
+ fY = (fBaseValue < fScaledUpperYValue) ? fScaledUpperYValue : fScaledLowerYValue;
+ rAlignment = bNormalOutside ? LABEL_ALIGN_BOTTOM : LABEL_ALIGN_TOP;
+ break;
+ case css::chart::DataLabelPlacement::CENTER:
+ fY -= (fScaledUpperYValue - fScaledLowerYValue) / 2.0;
+ rAlignment = LABEL_ALIGN_CENTER;
+ break;
+ default:
+ OSL_FAIL("this label alignment is not implemented yet");
+ break;
+ }
+
+ drawing::Position3D aScenePosition3D(
+ pPosHelper->transformScaledLogicToScene(fScaledX, fY, 0.0, true));
+ return LabelPositionHelper(2, m_xLogicTarget).transformSceneToScreenPosition(aScenePosition3D);
+}
+
+void HistogramChart::addSeries(std::unique_ptr<VDataSeries> pSeries, sal_Int32 zSlot,
+ sal_Int32 xSlot, sal_Int32 ySlot)
+{
+ if (!pSeries)
+ return;
+
+ if (m_nDimension == 2)
+ {
+ sal_Int32 nAxisIndex = pSeries->getAttachedAxisIndex();
+ zSlot = nAxisIndex;
+
+ if (!pSeries->getGroupBarsPerAxis())
+ zSlot = 0;
+ if (zSlot >= static_cast<sal_Int32>(m_aZSlots.size()))
+ m_aZSlots.resize(zSlot + 1);
+ }
+ VSeriesPlotter::addSeries(std::move(pSeries), zSlot, xSlot, ySlot);
+ adaptGapwidthForHistogram();
+}
+
void HistogramChart::adaptGapwidthForHistogram()
{
VDataSeries* pFirstSeries = getFirstSeries();
@@ -83,7 +162,7 @@ void HistogramChart::createShapes()
// Create groups for different types of shapes
rtl::Reference<SvxShapeGroupAnyD> xSeriesTarget = createGroupShape(m_xLogicTarget);
- rtl::Reference<SvxShapeGroupAnyD> xTextTarget = ShapeFactory::createGroup2D(m_xFinalTarget);
+ //rtl::Reference<SvxShapeGroupAnyD> xTextTarget = ShapeFactory::createGroup2D(m_xFinalTarget);
// Ensure proper handling of shapes and scenes
std::unordered_set<rtl::Reference<SvxShape>> aShapeSet;
@@ -108,7 +187,7 @@ void HistogramChart::createShapes()
adaptGapwidthForHistogram();
//better performance for big data
- std::map<VDataSeries*, FormerBarPoint> aSeriesFormerPointMap;
+ //std::map<VDataSeries*, FormerBarPoint> aSeriesFormerPointMap;
m_bPointsWereSkipped = false;
sal_Int32 nStartIndex = 0;
sal_Int32 nEndIndex = VSeriesPlotter::getPointCount();
@@ -136,96 +215,16 @@ void HistogramChart::createShapes()
aLogicYSumMap[nAttachedAxisIndex] += fabs(fMinimumY);
}
- doZSlot(rZSlot, nPointIndex, nStartIndex, xSeriesTarget, xTextTarget, aShapeSet,
- aSeriesFormerPointMap, aLogicYSumMap);
+ doZSlot(rZSlot, nPointIndex, xSeriesTarget, aShapeSet, aLogicYSumMap);
} //next category
}
-void HistogramChart::addSeries(std::unique_ptr<VDataSeries> pSeries, sal_Int32 zSlot,
- sal_Int32 xSlot, sal_Int32 ySlot)
-{
- if (!pSeries)
- return;
-
- if (m_nDimension == 2)
- {
- sal_Int32 nAxisIndex = pSeries->getAttachedAxisIndex();
- zSlot = nAxisIndex;
-
- if (!pSeries->getGroupBarsPerAxis())
- zSlot = 0;
- if (zSlot >= static_cast<sal_Int32>(m_aZSlots.size()))
- m_aZSlots.resize(zSlot + 1);
- }
- VSeriesPlotter::addSeries(std::move(pSeries), zSlot, xSlot, ySlot);
- adaptGapwidthForHistogram();
-}
-
-css::drawing::Direction3D HistogramChart::getPreferredDiagramAspectRatio() const
-{
- // Return the preferred aspect ratio for the histogram chart
- return css::drawing::Direction3D(-1, -1, -1);
-}
-
-PlottingPositionHelper& HistogramChart::getPlottingPositionHelper(sal_Int32 nAxisIndex) const
-{
- PlottingPositionHelper& rPosHelper = VSeriesPlotter::getPlottingPositionHelper(nAxisIndex);
- BarPositionHelper* pBarPosHelper = dynamic_cast<BarPositionHelper*>(&rPosHelper);
- if (pBarPosHelper && nAxisIndex >= 0)
- {
- if (nAxisIndex < m_aGapwidthSequence.getLength())
- pBarPosHelper->setOuterDistance(m_aGapwidthSequence[nAxisIndex] / 100.0);
- }
- return rPosHelper;
-}
-
-awt::Point HistogramChart::getLabelScreenPositionAndAlignment(
- LabelAlignment& rAlignment, sal_Int32 nLabelPlacement, double fScaledX,
- double fScaledLowerYValue, double fScaledUpperYValue, double fBaseValue,
- BarPositionHelper const* pPosHelper) const
-{
- double fY = fScaledUpperYValue;
- bool bReverse = !pPosHelper->isMathematicalOrientationY();
- bool bNormalOutside = (!bReverse == (fBaseValue < fScaledUpperYValue));
-
- switch (nLabelPlacement)
- {
- case css::chart::DataLabelPlacement::TOP:
- fY = bReverse ? fScaledLowerYValue : fScaledUpperYValue;
- rAlignment = LABEL_ALIGN_TOP;
- break;
- case css::chart::DataLabelPlacement::BOTTOM:
- fY = bReverse ? fScaledUpperYValue : fScaledLowerYValue;
- rAlignment = LABEL_ALIGN_BOTTOM;
- break;
- case css::chart::DataLabelPlacement::OUTSIDE:
- fY = (fBaseValue < fScaledUpperYValue) ? fScaledUpperYValue : fScaledLowerYValue;
- rAlignment = bNormalOutside ? LABEL_ALIGN_TOP : LABEL_ALIGN_BOTTOM;
- break;
- case css::chart::DataLabelPlacement::INSIDE:
- fY = (fBaseValue < fScaledUpperYValue) ? fScaledUpperYValue : fScaledLowerYValue;
- rAlignment = bNormalOutside ? LABEL_ALIGN_BOTTOM : LABEL_ALIGN_TOP;
- break;
- case css::chart::DataLabelPlacement::CENTER:
- fY -= (fScaledUpperYValue - fScaledLowerYValue) / 2.0;
- rAlignment = LABEL_ALIGN_CENTER;
- break;
- default:
- OSL_FAIL("this label alignment is not implemented yet");
- break;
- }
-
- drawing::Position3D aScenePosition3D(
- pPosHelper->transformScaledLogicToScene(fScaledX, fY, 0.0, true));
- return LabelPositionHelper(2, m_xLogicTarget).transformSceneToScreenPosition(aScenePosition3D);
-}
-
void HistogramChart::doZSlot(const std::vector<VDataSeriesGroup>& rZSlot,
- const sal_Int32 nPointIndex, const sal_Int32 nStartIndex,
+ const sal_Int32 nPointIndex,
const rtl::Reference<SvxShapeGroupAnyD>& xSeriesTarget,
- const rtl::Reference<SvxShapeGroupAnyD>& xTextTarget,
+ //const rtl::Reference<SvxShapeGroupAnyD>& xTextTarget,
std::unordered_set<rtl::Reference<SvxShape>>& aShapeSet,
- std::map<VDataSeries*, FormerBarPoint>& aSeriesFormerPointMap,
+ //std::map<VDataSeries*, FormerBarPoint>& aSeriesFormerPointMap,
std::map<sal_Int32, double>& aLogicYSumMap)
{
//iterate through all x slots in this category
@@ -243,7 +242,7 @@ void HistogramChart::doZSlot(const std::vector<VDataSeriesGroup>& rZSlot,
//update/create information for current group
pPosHelper->updateSeriesCount(rZSlot.size());
- double fLogicBaseWidth = pPosHelper->getScaledSlotWidth();
+ //double fLogicBaseWidth = pPosHelper->getScaledSlotWidth();
// get distance from base value to maximum and minimum
@@ -253,307 +252,93 @@ void HistogramChart::doZSlot(const std::vector<VDataSeriesGroup>& rZSlot,
isSeparateStackingForDifferentSigns(1), fMinimumY,
fMaximumY, nAttachedAxisIndex);
- double fLogicPositiveYSum = 0.0;
- if (!std::isnan(fMaximumY))
- fLogicPositiveYSum = fMaximumY;
+ // double fLogicPositiveYSum = 0.0;
+ // if (!std::isnan(fMaximumY))
+ // fLogicPositiveYSum = fMaximumY;
- double fLogicNegativeYSum = 0.0;
- if (!std::isnan(fMinimumY))
- fLogicNegativeYSum = fMinimumY;
+ // double fLogicNegativeYSum = 0.0;
+ // if (!std::isnan(fMinimumY))
+ // fLogicNegativeYSum = fMinimumY;
- doXSlot(rXSlot, nPointIndex, nStartIndex, xSeriesTarget, xTextTarget, aShapeSet,
- aSeriesFormerPointMap, aLogicYSumMap, fLogicBaseWidth, fSlotX, pPosHelper,
- fLogicPositiveYSum, fLogicNegativeYSum, nAttachedAxisIndex);
+ doXSlot(rXSlot, nPointIndex, xSeriesTarget, aShapeSet, aLogicYSumMap, pPosHelper);
fSlotX += 1.0;
} //next x slot
}
void HistogramChart::doXSlot(const VDataSeriesGroup& rXSlot, const sal_Int32 nPointIndex,
- const sal_Int32 nStartIndex,
const rtl::Reference<SvxShapeGroupAnyD>& xSeriesTarget,
- const rtl::Reference<SvxShapeGroupAnyD>& xTextTarget,
std::unordered_set<rtl::Reference<SvxShape>>& aShapeSet,
- std::map<VDataSeries*, FormerBarPoint>& aSeriesFormerPointMap,
std::map<sal_Int32, double>& aLogicYSumMap,
- const double fLogicBaseWidth, const double fSlotX,
- BarPositionHelper* const pPosHelper, const double fLogicPositiveYSum,
- const double fLogicNegativeYSum, const sal_Int32 nAttachedAxisIndex)
+ BarPositionHelper* const pPosHelper)
{
- double fBaseValue = 0.0;
- if (!pPosHelper->isPercentY() && rXSlot.m_aSeriesVector.size() <= 1)
- fBaseValue = pPosHelper->getBaseValueY();
- double fPositiveLogicYForNextSeries = fBaseValue;
- double fNegativeLogicYForNextSeries = fBaseValue;
-
- //iterate through all series in this x slot
- for (std::unique_ptr<VDataSeries> const& pSeries : rXSlot.m_aSeriesVector)
+ if (rXSlot.m_aSeriesVector.empty())
+ return; // Early exit if no series
+
+ // Find the min and max Y values to determine bin ranges
+ auto minmaxY = std::minmax_element(rXSlot.m_aSeriesVector.begin(), rXSlot.m_aSeriesVector.end(),
+ [nPointIndex](const std::unique_ptr<VDataSeries>& a, const std::unique_ptr<VDataSeries>& b) {
+ return a->getYValue(nPointIndex) < b->getYValue(nPointIndex);
+ });
+ double fMinY = (*minmaxY.first)->getYValue(nPointIndex);
+ double fMaxY = (*minmaxY.second)->getYValue(nPointIndex);
+ double binRange = (fMaxY - fMinY) / static_cast<double>(m_histogramType.getNumBins());
+
+ for (const auto& pSeries : rXSlot.m_aSeriesVector)
{
- if (!pSeries)
- continue;
+ if (!pSeries) continue;
- bool bHasFillColorMapping = pSeries->hasPropertyMapping(u"FillColor"_ustr);
+ // Extract and rasterize X value
+ double fLogicX = pSeries->getXValue(nPointIndex);
+ fLogicX = DateHelper::RasterizeDateValue(fLogicX, m_aNullDate, m_nTimeResolution);
- if (nPointIndex == nStartIndex) //do not create a regression line for each point
- break;
- // Use another XShapes for background, so we can avoid needing to set the Z-order on all of them,
- // which is expensive in bulk.
- rtl::Reference<SvxShapeGroupAnyD> xSeriesGroupShape_Shapes(
- getSeriesGroupShape(pSeries.get(), xSeriesTarget));
- rtl::Reference<SvxShapeGroupAnyD> xSeriesBackgroundShape_Shapes(
- getSeriesGroupShape(pSeries.get(), xSeriesTarget));
- aShapeSet.insert(xSeriesGroupShape_Shapes);
- aShapeSet.insert(xSeriesBackgroundShape_Shapes);
- // Suspend setting rects dirty for the duration of this call
- E3dScene* pScene = DynCastE3dScene(xSeriesGroupShape_Shapes->GetSdrObject());
- if (pScene)
- pScene->SuspendReportingDirtyRects();
- pScene = DynCastE3dScene(xSeriesBackgroundShape_Shapes->GetSdrObject());
- if (pScene)
- pScene->SuspendReportingDirtyRects();
-
- //collect data point information (logic coordinates, style ):
- double fUnscaledLogicX = pSeries->getXValue(nPointIndex);
- fUnscaledLogicX
- = DateHelper::RasterizeDateValue(fUnscaledLogicX, m_aNullDate, m_nTimeResolution);
- if (std::isnan(fUnscaledLogicX))
- continue; //point not visible
- if (fUnscaledLogicX < pPosHelper->getLogicMinX())
- continue; //point not visible
- if (fUnscaledLogicX > pPosHelper->getLogicMaxX())
- continue; //point not visible
- if (pPosHelper->isStrongLowerRequested(0) && fUnscaledLogicX == pPosHelper->getLogicMaxX())
- continue; //point not visible
- double fLogicX = pPosHelper->getScaledSlotPos(fUnscaledLogicX, fSlotX);
-
- double fLogicBarHeight = pSeries->getYValue(nPointIndex);
- if (std::isnan(fLogicBarHeight)) //no value at this category
- continue;
-
- double fLogicValueForLabeDisplay = fLogicBarHeight;
- fLogicBarHeight -= fBaseValue;
-
- if (pPosHelper->isPercentY())
- {
- if (fLogicPositiveYSum != 0.0)
- fLogicBarHeight = fabs(fLogicBarHeight) / fLogicPositiveYSum;
- else
- fLogicBarHeight = 0.0;
- }
+ // Skip if the value is not within the logic bounds
+ if (std::isnan(fLogicX) || fLogicX < pPosHelper->getLogicMinX() || fLogicX > pPosHelper->getLogicMaxX()) continue;
- // tdf#114141 to draw the top of the zero height 3D bar
- // we set a small positive value, here the smallest one for the type double (DBL_MIN)
- if (fLogicBarHeight == 0.0)
- fLogicBarHeight = DBL_MIN;
-
- //sort negative and positive values, to display them on different sides of the x axis
- bool bPositive = fLogicBarHeight >= 0.0;
- double fLowerYValue
- = bPositive ? fPositiveLogicYForNextSeries : fNegativeLogicYForNextSeries;
- double fUpperYValue = fLowerYValue + fLogicBarHeight;
- if (bPositive)
- fPositiveLogicYForNextSeries += fLogicBarHeight;
- else
- fNegativeLogicYForNextSeries += fLogicBarHeight;
-
- double fLogicZ = 1.0; //as defined
-
- drawing::Position3D aUnscaledLogicPosition(fUnscaledLogicX, fUpperYValue, fLogicZ);
-
- //@todo ... start an iteration over the different breaks of the axis
- //each subsystem may add an additional shape to form the whole point
- //create a group shape for this point and add to the series shape:
- // uno::Reference< drawing::XShapes > xPointGroupShape_Shapes( createGroupShape(xSeriesGroupShape_Shapes) );
- // uno::Reference<drawing::XShape> xPointGroupShape_Shape =
- // uno::Reference<drawing::XShape>( xPointGroupShape_Shapes, uno::UNO_QUERY );
- //as long as we do not iterate we do not need to create an additional group for each point
- uno::Reference<beans::XPropertySet> xDataPointProperties(
- pSeries->getPropertiesOfPoint(nPointIndex));
-
- //@todo iterate through all subsystems to create partial points
- {
- //@todo select a suitable PositionHelper for this subsystem
- BarPositionHelper* pSubPosHelper = pPosHelper;
-
- double fUnclippedUpperYValue = fUpperYValue;
-
- //@todo clipping of X and Z is not fully integrated so far, as there is a need to create different objects
-
- //apply scaling to Y before calculating width (necessary to maintain gradient in clipped objects)
- pSubPosHelper->doLogicScaling(nullptr, &fLowerYValue, nullptr);
- pSubPosHelper->doLogicScaling(nullptr, &fUpperYValue, nullptr);
- //scaling of X and Z is not provided as the created objects should be symmetric in that dimensions
-
- pSubPosHelper->doLogicScaling(nullptr, &fUnclippedUpperYValue, nullptr);
-
- //calculate resulting width
- double fCompleteHeight = bPositive ? fLogicPositiveYSum : fLogicNegativeYSum;
- if (pPosHelper->isPercentY())
- fCompleteHeight = 1.0;
- double fLogicBarWidth = fLogicBaseWidth;
- double fTopHeight = approxSub(fCompleteHeight, fUpperYValue);
- if (!bPositive)
- fTopHeight = approxSub(fCompleteHeight, fLowerYValue);
- double fLogicYStart = bPositive ? fLowerYValue : fUpperYValue;
- double fMiddleHeight = fUpperYValue - fLowerYValue;
- if (!bPositive)
- fMiddleHeight *= -1.0;
- double fLogicBarDepth = 0.5;
-
- //better performance for big data
- FormerBarPoint aFormerPoint(aSeriesFormerPointMap[pSeries.get()]);
- pPosHelper->setCoordinateSystemResolution(m_aCoordinateSystemResolution);
- if (!pSeries->isAttributedDataPoint(nPointIndex)
- && pPosHelper->isSameForGivenResolution(aFormerPoint.m_fX, aFormerPoint.m_fUpperY,
- aFormerPoint.m_fZ, fLogicX, fUpperYValue,
- fLogicZ)
- && pPosHelper->isSameForGivenResolution(aFormerPoint.m_fX, aFormerPoint.m_fLowerY,
- aFormerPoint.m_fZ, fLogicX, fLowerYValue,
- fLogicZ))
- {
- m_bPointsWereSkipped = true;
- continue;
- }
- aSeriesFormerPointMap[pSeries.get()]
- = FormerBarPoint(fLogicX, fUpperYValue, fLowerYValue, fLogicZ);
+ // Calculate Y value and adjust for binning
+ double fLogicY = pSeries->getYValue(nPointIndex);
+ if (std::isnan(fLogicY)) continue;
- //maybe additional possibility for performance improvement
- //bool bCreateLineInsteadOfComplexGeometryDueToMissingSpace = false;
- //pPosHelper->isSameForGivenResolution( fLogicX-fLogicBarWidth/2.0, fLowerYValue, fLogicZ
- // , fLogicX+fLogicBarWidth/2.0, fLowerYValue, fLogicZ );
+ // Determine the bin index based on Y value
+ int binIndex = static_cast<int>((fLogicY - fMinY) / binRange);
- //create partial point
- if (!approxEqual(fLowerYValue, fUpperYValue))
- {
- rtl::Reference<SvxShape> xShape;
- if (m_nDimension == 3)
- {
- //drawing::Position3D aLogicBottom (fLogicX,fLogicYStart,fLogicZ);
- drawing::Position3D aLogicLeftBottomFront(fLogicX + fLogicBarWidth / 2.0,
- fLogicYStart,
- fLogicZ - fLogicBarDepth / 2.0);
- drawing::Position3D aLogicRightDeepTop(fLogicX - fLogicBarWidth / 2.0,
- fLogicYStart + fMiddleHeight,
- fLogicZ + fLogicBarDepth / 2.0);
- drawing::Position3D aLogicTopTop(
- fLogicX, fLogicYStart + fMiddleHeight + fTopHeight, fLogicZ);
-
- ::chart::XTransformation2* pTransformation
- = pSubPosHelper->getTransformationScaledLogicToScene();
-
- //transformation 3) -> 4)
- //drawing::Position3D aTransformedBottom ( pTransformation->transform( aLogicBottom ) );
- drawing::Position3D aTransformedLeftBottomFront(
- pTransformation->transform(aLogicLeftBottomFront));
- drawing::Position3D aTransformedRightDeepTop(
- pTransformation->transform(aLogicRightDeepTop));
- drawing::Position3D aTransformedTopTop(
- pTransformation->transform(aLogicTopTop));
-
- drawing::Direction3D aSize
- = aTransformedRightDeepTop - aTransformedLeftBottomFront;
- drawing::Direction3D aTopSize(aTransformedTopTop - aTransformedRightDeepTop);
- fTopHeight = aTopSize.DirectionY;
-
- //sal_Int32 nRotateZAngleHundredthDegree = 0;
- if (pPosHelper->isSwapXAndY())
- {
- fTopHeight = aTopSize.DirectionX;
- //nRotateZAngleHundredthDegree = 90*100;
- aSize = drawing::Direction3D(aSize.DirectionY, aSize.DirectionX,
- aSize.DirectionZ);
- }
-
- if (aSize.DirectionX < 0)
- aSize.DirectionX *= -1.0;
- if (aSize.DirectionZ < 0)
- aSize.DirectionZ *= -1.0;
- if (fTopHeight < 0)
- fTopHeight *= -1.0;
- }
- else //m_nDimension!=3
- {
- drawing::Position3D aLeftUpperPoint(fLogicX - fLogicBarWidth / 2.0,
- fUpperYValue, fLogicZ);
- drawing::Position3D aRightUpperPoint(fLogicX + fLogicBarWidth / 2.0,
- fUpperYValue, fLogicZ);
- std::vector<std::vector<css::drawing::Position3D>> aPoly{
- { // inner vector
- drawing::Position3D(fLogicX - fLogicBarWidth / 2.0, fLowerYValue,
- fLogicZ),
- drawing::Position3D(fLogicX + fLogicBarWidth / 2.0, fLowerYValue,
- fLogicZ),
- aRightUpperPoint, aLeftUpperPoint,
- drawing::Position3D(fLogicX - fLogicBarWidth / 2.0, fLowerYValue,
- fLogicZ) }
- };
- pPosHelper->transformScaledLogicToScene(aPoly);
- xShape = ShapeFactory::createArea2D(xSeriesGroupShape_Shapes, aPoly);
- PropertyMapper::setMappedProperties(
- *xShape, xDataPointProperties,
- PropertyMapper::getPropertyNameMapForFilledSeriesProperties());
- }
-
- if (bHasFillColorMapping)
- {
- double nPropVal = pSeries->getValueByProperty(nPointIndex, u"FillColor"_ustr);
- if (!std::isnan(nPropVal))
- {
- xShape->setPropertyValue(u"FillColor"_ustr,
- uno::Any(static_cast<sal_Int32>(nPropVal)));
- }
- }
- //set name/classified ObjectID (CID)
- ShapeFactory::setShapeName(xShape, ObjectIdentifier::createPointCID(
- pSeries->getPointCID_Stub(), nPointIndex));
- }
+ // Accumulate the frequencies in the bin
+ aLogicYSumMap[binIndex] += fLogicY;
- //create error bar
- createErrorBar_Y(aUnscaledLogicPosition, *pSeries, nPointIndex, m_xLogicTarget,
- &fLogicX);
+ // Calculate base and upper Y values for the bin
+ double fBaseValue = 0.0;
+ double fUpperYValue = aLogicYSumMap[binIndex];
- //create data point label
- if (pSeries->getDataPointLabelIfLabel(nPointIndex))
+ // Create and transform the rectangle shape for the histogram bar
+ std::vector<std::vector<css::drawing::Position3D>> aPoly =
+ {
{
- double fLogicSum = aLogicYSumMap[nAttachedAxisIndex];
-
- LabelAlignment eAlignment(LABEL_ALIGN_CENTER);
- sal_Int32 nLabelPlacement = pSeries->getLabelPlacement(
- nPointIndex, m_xChartTypeModel, pPosHelper->isSwapXAndY());
-
- double fLowerBarDepth = fLogicBarDepth;
- double fUpperBarDepth = fLogicBarDepth;
- {
- if (fCompleteHeight != 0.0)
- {
- double fOuterBarDepth
- = fLogicBarDepth * fTopHeight / (fabs(fCompleteHeight));
- fLowerBarDepth = (fBaseValue < fUpperYValue) ? fabs(fLogicBarDepth)
- : fabs(fOuterBarDepth);
- fUpperBarDepth = (fBaseValue < fUpperYValue) ? fabs(fOuterBarDepth)
- : fabs(fLogicBarDepth);
- }
- }
-
- awt::Point aScreenPosition2D = getLabelScreenPositionAndAlignment(
- eAlignment, nLabelPlacement, fLogicX, fLowerBarDepth, fUpperBarDepth,
- fBaseValue, pPosHelper);
- sal_Int32 nOffset = 0;
- if (eAlignment != LABEL_ALIGN_CENTER)
- {
- nOffset = 100; //add some spacing //@todo maybe get more intelligent values
- if (m_nDimension == 3)
- nOffset = 260;
- }
- createDataLabel(xTextTarget, *pSeries, nPointIndex, fLogicValueForLabeDisplay,
- fLogicSum, aScreenPosition2D, eAlignment, nOffset);
+ drawing::Position3D(fLogicX - m_histogramType.getBinWidth() / 2, fBaseValue, 1.0),
+ drawing::Position3D(fLogicX + m_histogramType.getBinWidth() / 2, fUpperYValue, 1.0)
}
+ };
+ pPosHelper->transformScaledLogicToScene(aPoly);
+ rtl::Reference<SvxShape> xShape = ShapeFactory::createArea2D(xSeriesTarget, aPoly);
+
+ // Apply properties and color mapping
+ uno::Reference<beans::XPropertySet> xDataPointProperties(pSeries->getPropertiesOfPoint(nPointIndex));
+ PropertyMapper::setMappedProperties(*xShape, xDataPointProperties, PropertyMapper::getPropertyNameMapForFilledSeriesProperties());
+ if (pSeries->hasPropertyMapping(u"FillColor"_ustr))
+ {
+ double nPropVal = pSeries->getValueByProperty(nPointIndex, u"FillColor"_ustr);
+ if (!std::isnan(nPropVal))
+ {
+ xShape->setPropertyValue(u"FillColor"_ustr, uno::Any(static_cast<sal_Int32>(nPropVal)));
+ }
+ }
- } //end iteration through partial points
-
- } //next series in x slot (next y slot)
+ // Add the shape to the series target
+ xSeriesTarget->add(xShape);
+ aShapeSet.insert(xShape);
+ }
}
+
} // namespace chart
/* vim:set shiftwidth=4 softtabstop=4 expandtab cinoptions=b1,g0,N-s cinkeys+=0=break: */
diff --git a/chart2/source/view/charttypes/HistogramChart.hxx b/chart2/source/view/charttypes/HistogramChart.hxx
index 6fcba98955b0..7fd991e08d98 100644
--- a/chart2/source/view/charttypes/HistogramChart.hxx
+++ b/chart2/source/view/charttypes/HistogramChart.hxx
@@ -67,20 +67,19 @@ private:
};
void doZSlot(const std::vector<VDataSeriesGroup>& rZSlot, sal_Int32 nPointIndex,
- sal_Int32 nStartIndex, const rtl::Reference<SvxShapeGroupAnyD>& xSeriesTarget,
- const rtl::Reference<SvxShapeGroupAnyD>& xTextTarget,
+ const rtl::Reference<SvxShapeGroupAnyD>& xSeriesTarget,
+ //const rtl::Reference<SvxShapeGroupAnyD>& xTextTarget,
std::unordered_set<rtl::Reference<SvxShape>>& aShapeSet,
- std::map<VDataSeries*, FormerBarPoint>& aSeriesFormerPointMap,
+ //std::map<VDataSeries*, FormerBarPoint>& aSeriesFormerPointMap,
std::map<sal_Int32, double>& aLogicYSumMap);
- void doXSlot(const VDataSeriesGroup& rXSlot, sal_Int32 nPointIndex, sal_Int32 nStartIndex,
+ void doXSlot(const VDataSeriesGroup& rXSlot, sal_Int32 nPointIndex,
const rtl::Reference<SvxShapeGroupAnyD>& xSeriesTarget,
- const rtl::Reference<SvxShapeGroupAnyD>& xTextTarget,
+ //const rtl::Reference<SvxShapeGroupAnyD>& xTextTarget,
std::unordered_set<rtl::Reference<SvxShape>>& aShapeSet,
- std::map<VDataSeries*, FormerBarPoint>& aSeriesFormerPointMap,
- std::map<sal_Int32, double>& aLogicYSumMap, double fLogicBaseWidth, double fSlotX,
- BarPositionHelper* const pPosHelper, double fLogicPositiveYSum,
- double fLogicNegativeYSum, sal_Int32 nAttachedAxisIndex);
+ //std::map<VDataSeries*, FormerBarPoint>& aSeriesFormerPointMap,
+ std::map<sal_Int32, double>& aLogicYSumMap,
+ BarPositionHelper* const pPosHelper);
private:
BarPositionHelper m_aMainPosHelper;
