Hello.

I have a strange problem with HTB.
The configuration is:
tc qdisc add dev eth0 root handle 1: htb default 12 r2q 1
tc class add dev eth0 parent 1: classid 1:1 htb rate 78kbit ceil 78kbit burst 3K cburst 3K
tc class add dev eth0 parent 1:1 classid 1:10 htb rate 30kbit ceil 78kbit prio 0 burst 3K cburst 3K
tc class add dev eth0 parent 1:1 classid 1:11 htb rate 16kbit ceil 78kbit prio 1
tc class add dev eth0 parent 1:1 classid 1:12 htb rate 16kbit ceil 78kbit prio 2
tc class add dev eth0 parent 1:1 classid 1:13 htb rate 16kbit ceil 78kbit prio 7 burst 1 cburst 1

iptables -A POSTROUTING -t mangle -o eth0 -m length --length 0:1024 -p tcp --dport ssh -j MARK --set-mark 10
# 554 realplayer, 123 ntpd
iptables -A POSTROUTING -t mangle -o eth0 -p tcp -m multiport --destination-ports ircd,ftp,domain,554 -j MARK --set-mark 10
iptables -A POSTROUTING -t mangle -o eth0 -p tcp --dport 123 -j MARK --set-mark 10
iptables -A POSTROUTING -t mangle -o eth0 -p udp --dport 123 -j MARK --set-mark 10

iptables -A POSTROUTING -t mangle -o eth0 -p tcp -m multiport --destination-ports ftp-data,www,https -j MARK --set-mark 11

iptables -A POSTROUTING -t mangle -o eth0 -m owner --uid-owner 102 -j MARK --set-mark 13

tc filter add dev eth0 parent 1:0 prio 1 protocol ip handle 10 fw flowid 1:10
tc filter add dev eth0 parent 1:0 prio 0 protocol ip handle 13 fw flowid 1:13
tc filter add dev eth0 parent 1:0 prio 1 protocol ip handle 11 fw flowid 1:11

In this situation most important are low priority traffic from UID
102, which is user mldonkey running mldonkey server and default
traffic. When there is now other network activity the band is totally
used by mldonkey, but when something else happens, it should force
out mldonkey traffic.

Now, let us look at the picture:
Attachment:
tc_stat.png
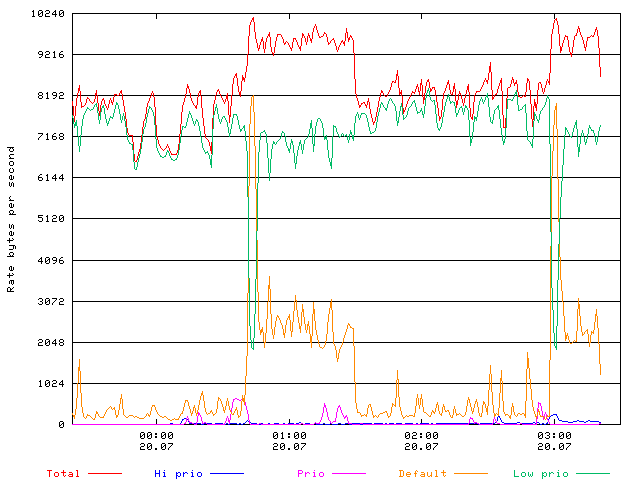
Description: Strange graphic
At bout 00:50 I've started an upload via rsync, which ended in about
1:30, but it was really more prioritised only for a couple of
minutes. At ~3:00 ftp upload started and we see the same picture.

What does it mean? Why does it happen.

PS You can ask, how did I get this picture. It is based on tc -s
output, and even small piece of software I've written to get
visualisation is not release quality, I attach it, probably, it will
help somebody.
Attachment:
tcstat.tar.gz
Description: Visualisation for tc -s
Thanks,
--
Alexander Kotelnikov
Saint-Petersburg, Russia
