Hi Yuhao,
sorry for the late answer. I've had holidays and just returned.
On Wed, 8 Aug 2018, 07:49 Yuhao Zhang, <zzyzxd@xxxxxxxxx> wrote:
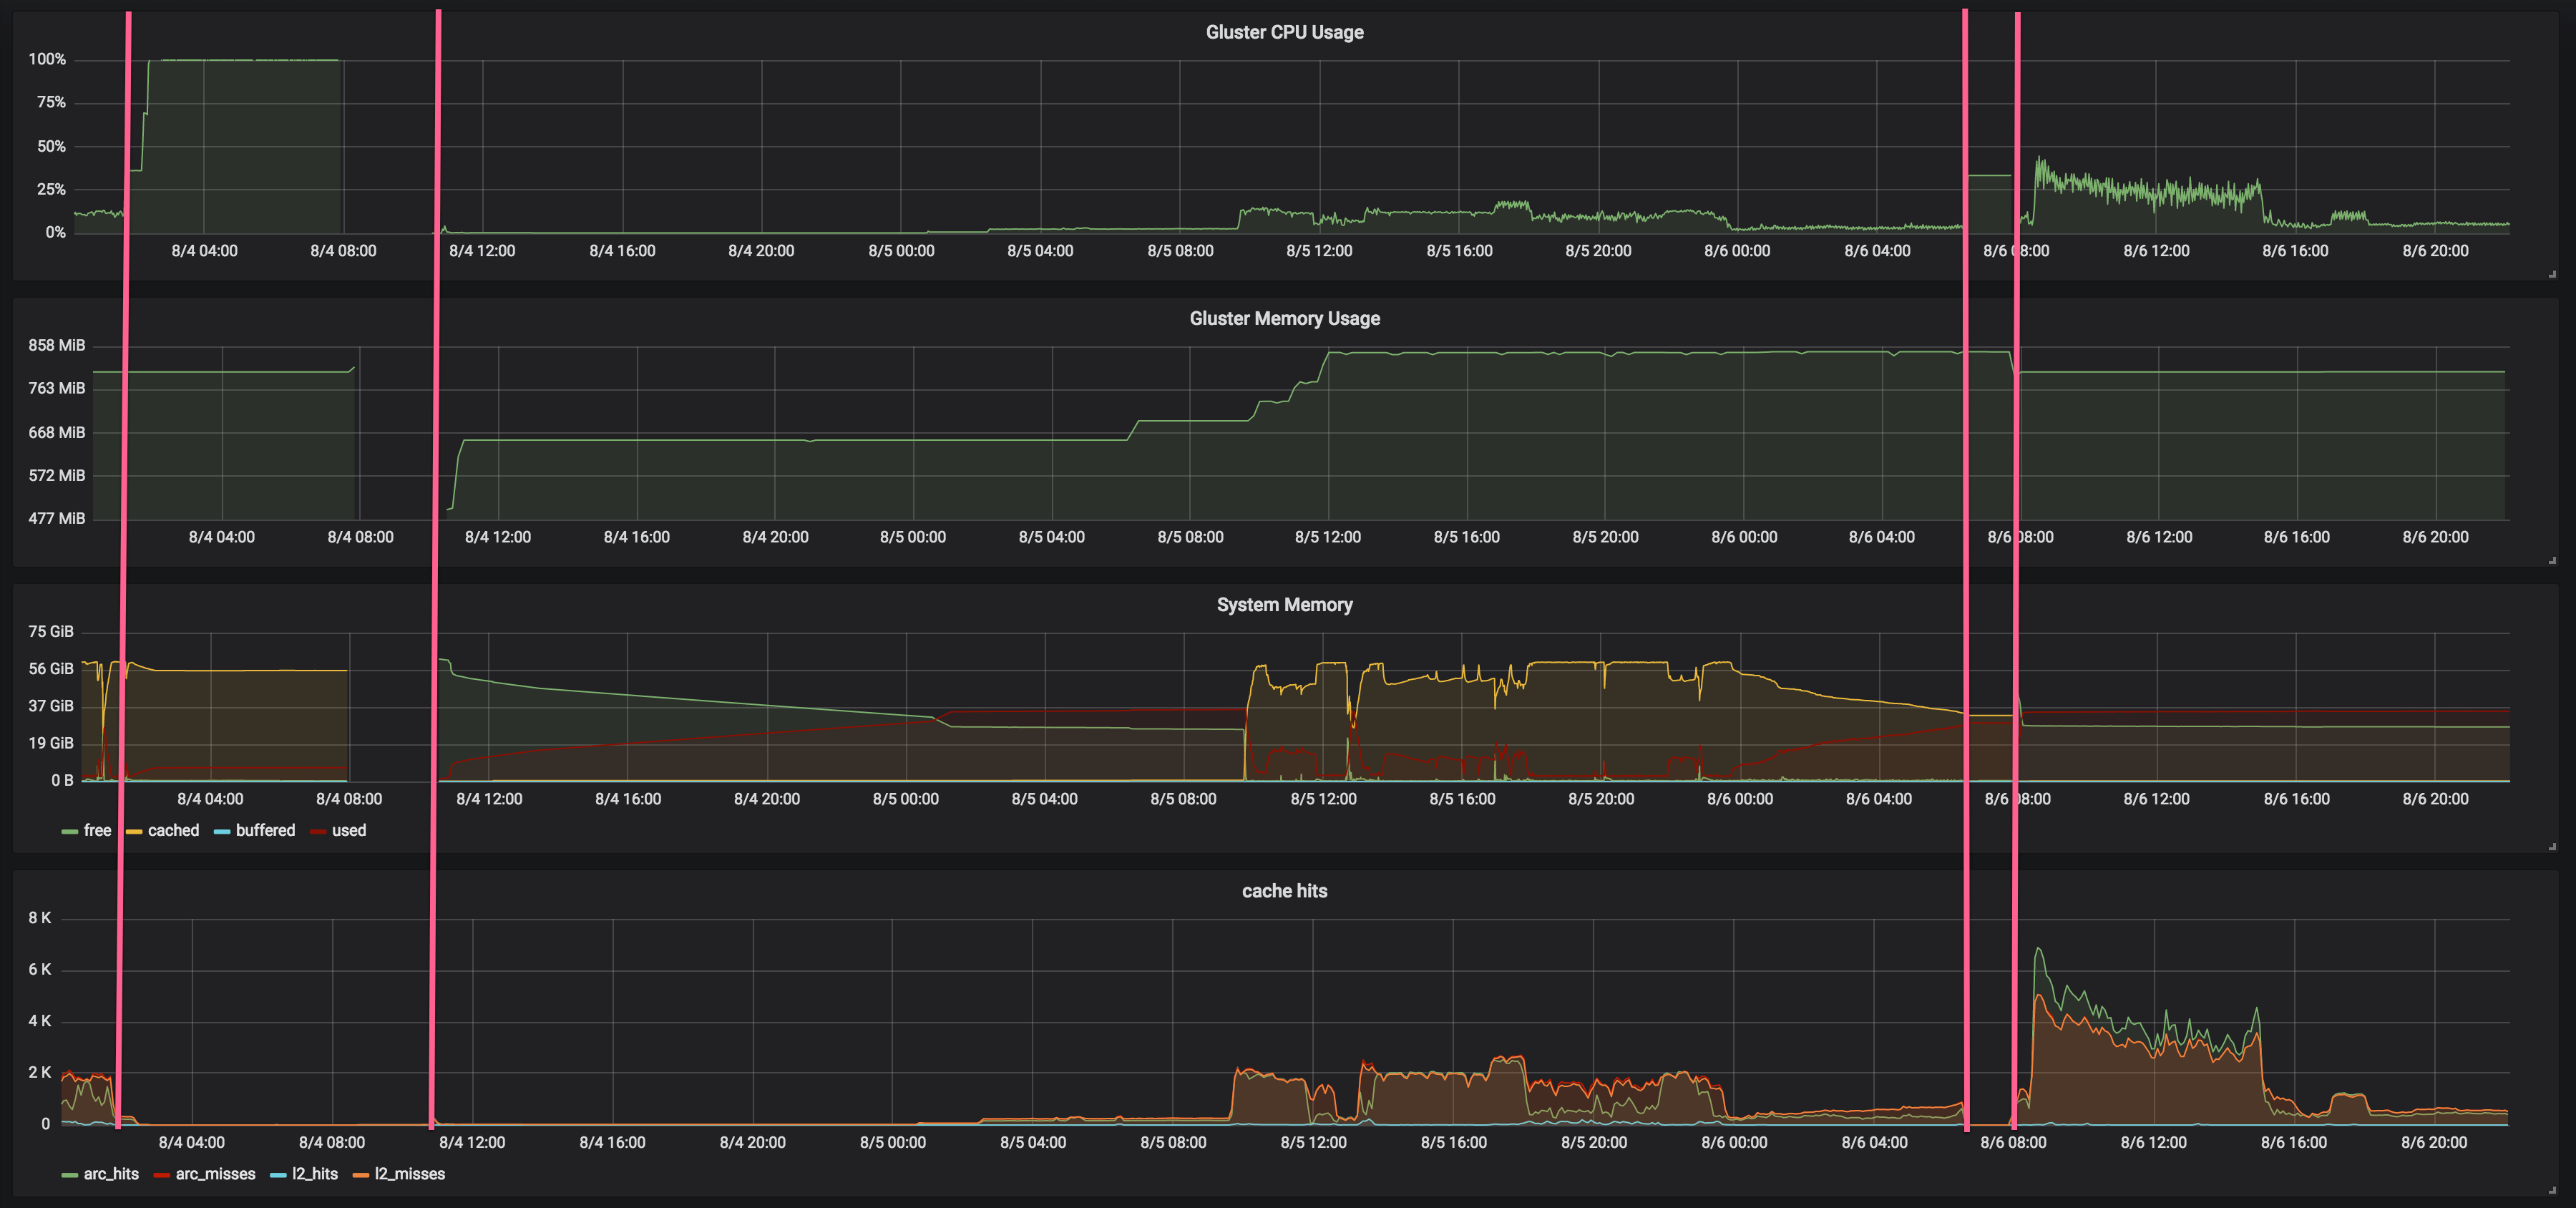
Hi Xavi,Thank you for the suggestions, these are extremely helpful. I haven't thought it could be ZFS problem. I went back and checked a longer monitoring window and now I can see a pattern. Please see this attached Grafana screenshot (also available here: https://cl.ly/070J2y3n1u0F . Note that the data gaps were when I took down the server for rebooting):Between 8/4 - 8/6, I tried two transfer tests, and experienced 2 the gluster hanging problems. One during the first transfer, and another one happened shortly after the second transfer. I blocked both in pink lines.Looks like during my transfer tests, free memory was almost exhausted. The system has a very high cached memory, which I think was due to ZFS ARC. However, I am under the impression that ZFS will release space from ARC if it observes low system available memory. I am not sure why it didn't do that.
Yes, it should release memory, but for some reason I don't understand, when there's high metadata load, it's not able to release the allocated memory fast enough (or so it seems). I've observed high CPU utilization by a ZFS process at this point.
I did't tweak related ZFS parameters. zfs_arc_max was set to 0 (default value). According to doc, it is "Max arc size of ARC in bytes. If set to 0 then it will consume 1/2 of system RAM." So it appeared that this setting didn't work.
From my experience, with high metadata load this limit is not respected. Using 1/8 of system RAM seemed to keep memory consumption under control, at least for the workloads I used.
In theory, ZFS 0.7.x.y should solve the memory management problems, but I haven't tested it.
When the server was under heavy IO, the used memory was instead decreased, which I can't explain.
I've only seen this problem when accessing large amounts of different files (typical on a copy, rsync or find on a volume with thousands or millions of files and directories). However, high IO on small set of files doesn't cause any trouble.
It's related with caching of metadata, so high IO on a small set of files doesn't require much metadata.
May I ask if you, or anyone else in this group, has recommendation on ZFS settings for my setup? My server has 64GB physical memory and 150GB SSD space reserved for L2_ARC.The zpool has 6 vdevs and each has 12TB * 10 hard drives on raidz2. Total usable space in the zpool is 482TB.
As I said, I would try with 1/8 of system memory for ARC (it will use more than that anyway). A drop cache also helps when memory is getting exhausted. It causes ZFS to release memory faster, though I don't consider it a good solution.
Also make sure that zfs_txg_timeout is set to 5 or a similar value to avoid long disk access bursts. Other options to consider, depending on the use case, are: zfs_disable_prefetch=1 and zfs_nocacheflush=1.
For better performance with gluster, xattr option on ZFS datasets should be set to "sa", but this needs to be done on volume creation, before creating files. Otherwise it will only be applied to newer files. To use "sa" safely, version 0.6.5.8 or higher should be used.
Xavi
Thank you,YuhaoOn Aug 7, 2018, at 01:36, Xavi Hernandez <jahernan@xxxxxxxxxx> wrote:Hi Yuhao,On Mon, 6 Aug 2018, 15:26 Yuhao Zhang, <zzyzxd@xxxxxxxxx> wrote:Hello,I just experienced another hanging one hour ago and the server was not even under heavy IO.Atin, I attached the process monitoring results and another statedump.Xavi, ZFS was fine, during the hanging, I can still write directly to the ZFS volume. My ZFS version: ZFS: Loaded module v0.6.5.6-0ubuntu16, ZFS pool version 5000, ZFS filesystem version 5I highly recommend you to upgrade to version 0.6.5.8 at least. It fixes a kernel panic that can happen when used with gluster. However this is not your current problem.Top statistics show low available memory and high CPU utilization of kswapd process (along with one of the gluster processes). I've seen frequent memory management problems with ZFS. Have you configured any ZFS parameters? It's highly recommendable to tweak some memory limits.If that were the problem, there's one thing that should alleviate it (and see if it could be related):echo 3 >/proc/sys/vm/drop_cachesThis should be done on all bricks from time to time. You can wait until the problem appears, but in this case the recovery time can be larger.I think this should fix the high CPU usage of kswapd. If so, we'll need to tweak some ZFS parameters.I'm not sure if the high CPU usage of gluster could be related to this or not.XaviThank you,Yuhao
Attachment:
Image 2018-08-07 at 23.59.09.png
Description: PNG image
_______________________________________________
Gluster-users mailing list
Gluster-users@xxxxxxxxxxx
https://lists.gluster.org/mailman/listinfo/gluster-users
