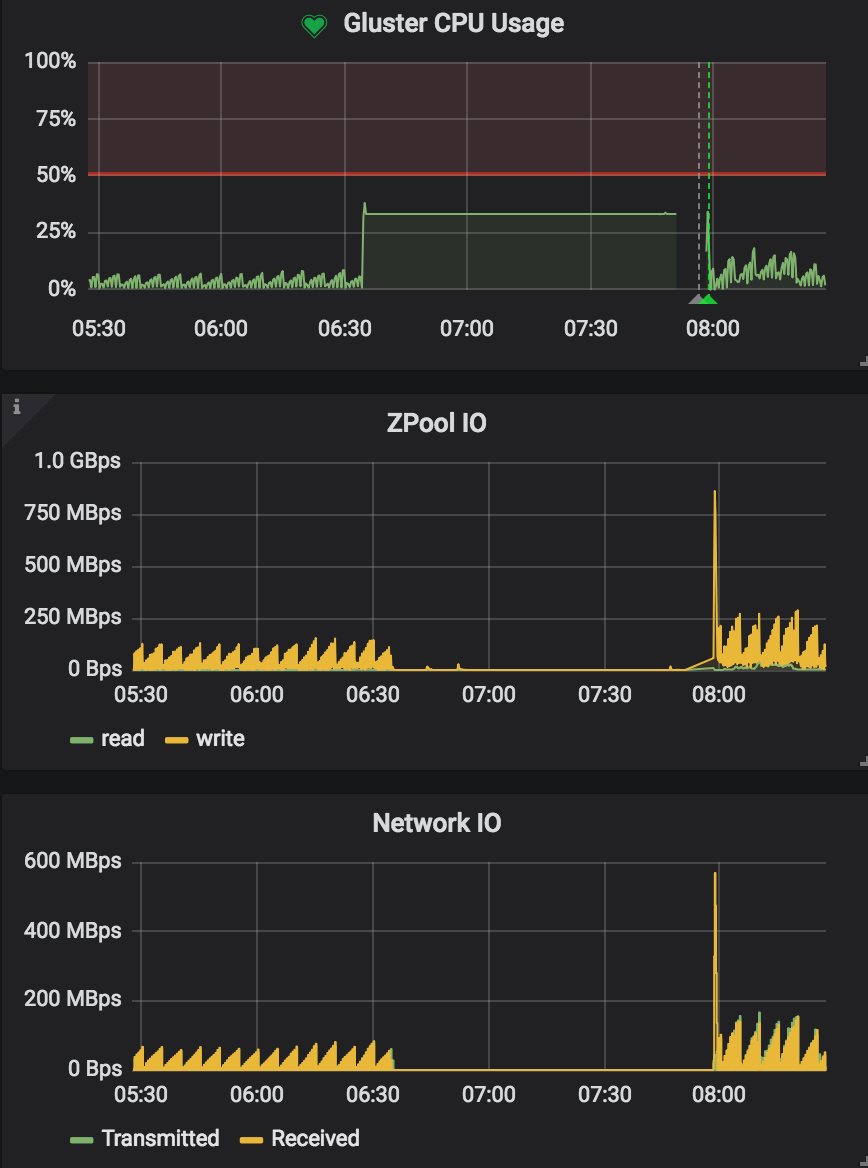
| Also, when it happened, Gluster CPU usage instantly jumped up and all the writes started to hang. Below is my server monitoring on Grafana (I have a telegraf agent running on the server to collect metrics.) The Gluster CPU usage is the usage of all gluster related processes(telegraf does a regex search to match all processes contain "gluster")
Hello,
I just experienced another hanging one hour ago and the server was not even under heavy IO.
Atin, I attached the process monitoring results and another statedump.
Xavi, ZFS was fine, during the hanging, I can still write directly to the ZFS volume. My ZFS version: ZFS: Loaded module v0.6.5.6-0ubuntu16, ZFS pool version 5000, ZFS filesystem version 5
Hi Yuhao,
Atin, that was my typo... I think it was glusterfsd, but not 100% sure. I will keep an eye when it happens next time.
Thank you all for looking into this! I tried another transfer earlier today but it didn't get the chance to reach the point where glusterfsd starts to fail before we needed to start the production mission critical jobs. I am going to try another time next week and report back to the thread.
Btw, I took a look into syslog and find this event happened right at the time when clients started to hang: Aug 4 01:54:45 ch1prdtick03 kernel: [30601.142702] INFO: task glusteriotwr3:6895 blocked for more than 120 seconds. Aug 4 01:54:45 ch1prdtick03 kernel: [30601.142760] Tainted: P O 4.4.0-116-generic #140-Ubuntu Aug 4 01:54:45 ch1prdtick03 kernel: [30601.142805] "echo 0 > /proc/sys/kernel/hung_task_timeout_secs" disables this message. Aug 4 01:54:45 ch1prdtick03 kernel: [30601.142863] glusteriotwr3 D ffff88102c18fb98 0 6895 1 0x00000000 Aug 4 01:54:45 ch1prdtick03 kernel: [30601.142872] ffff88102c18fb98 ffff88102c18fb68 ffff88085be0b800 ffff88103f314600 Aug 4 01:54:45 ch1prdtick03 kernel: [30601.142877] ffff88102c190000 ffff8805397fe0f4 ffff88103f314600 00000000ffffffff Aug 4 01:54:45 ch1prdtick03 kernel: [30601.142882] ffff8805397fe0f8 ffff88102c18fbb0 ffffffff8184ae45 ffff8805397fe0f0 Aug 4 01:54:45 ch1prdtick03 kernel: [30601.142887] Call Trace: Aug 4 01:54:45 ch1prdtick03 kernel: [30601.142899] [<ffffffff8184ae45>] schedule+0x35/0x80 Aug 4 01:54:45 ch1prdtick03 kernel: [30601.142904] [<ffffffff8184b0ee>] schedule_preempt_disabled+0xe/0x10 Aug 4 01:54:45 ch1prdtick03 kernel: [30601.142910] [<ffffffff8184cd29>] __mutex_lock_slowpath+0xb9/0x130 Aug 4 01:54:45 ch1prdtick03 kernel: [30601.142915] [<ffffffff8184cdbf>] mutex_lock+0x1f/0x30 Aug 4 01:54:45 ch1prdtick03 kernel: [30601.142922] [<ffffffff8122071d>] walk_component+0x21d/0x310 Aug 4 01:54:45 ch1prdtick03 kernel: [30601.142926] [<ffffffff81221ba1>] link_path_walk+0x191/0x5c0 Aug 4 01:54:45 ch1prdtick03 kernel: [30601.142931] [<ffffffff8121ff3b>] ? path_init+0x1eb/0x3c0 Aug 4 01:54:45 ch1prdtick03 kernel: [30601.142935] [<ffffffff812220cc>] path_lookupat+0x7c/0x110 Aug 4 01:54:45 ch1prdtick03 kernel: [30601.142940] [<ffffffff8123a828>] ? __vfs_setxattr_noperm+0x128/0x1a0 Aug 4 01:54:45 ch1prdtick03 kernel: [30601.142944] [<ffffffff81223d01>] filename_lookup+0xb1/0x180 Aug 4 01:54:45 ch1prdtick03 kernel: [30601.142948] [<ffffffff8123aadb>] ? setxattr+0x18b/0x200 Aug 4 01:54:45 ch1prdtick03 kernel: [30601.142955] [<ffffffff811f2109>] ? kmem_cache_alloc+0x189/0x1f0 Aug 4 01:54:45 ch1prdtick03 kernel: [30601.142960] [<ffffffff81223906>] ? getname_flags+0x56/0x1f0 Aug 4 01:54:45 ch1prdtick03 kernel: [30601.142964] [<ffffffff81223ea6>] user_path_at_empty+0x36/0x40 Aug 4 01:54:45 ch1prdtick03 kernel: [30601.142970] [<ffffffff81218d76>] vfs_fstatat+0x66/0xc0 Aug 4 01:54:45 ch1prdtick03 kernel: [30601.142975] [<ffffffff81219331>] SYSC_newlstat+0x31/0x60 Aug 4 01:54:45 ch1prdtick03 kernel: [30601.142980] [<ffffffff8121dade>] ? path_put+0x1e/0x30 Aug 4 01:54:45 ch1prdtick03 kernel: [30601.142984] [<ffffffff8123ac0f>] ? path_setxattr+0xbf/0xe0 Aug 4 01:54:45 ch1prdtick03 kernel: [30601.142989] [<ffffffff8121946e>] SyS_newlstat+0xe/0x10 Aug 4 01:54:45 ch1prdtick03 kernel: [30601.142996] [<ffffffff8184efc8>] entry_SYSCALL_64_fastpath+0x1c/0xbb
Which version of ZFS are you using ?
it seems like a hang inside ZFS. Xavi _______________________________________________
Gluster-users mailing list
Gluster-users@xxxxxxxxxxx
https://lists.gluster.org/mailman/listinfo/gluster-users
|
