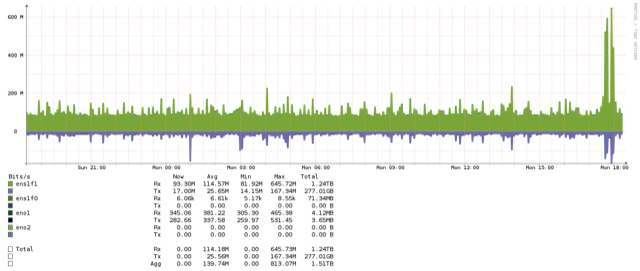
| Tony’s performance sounds significantly sub par from my experience. I did some testing with gluster 3.12 and Ovirt 3.9, on my running production cluster when I enabled the glfsapi, even my pre numbers are significantly better than what Tony is reporting: ——————————————————— Before using gfapi: ]# dd if=/dev/urandom of=test.file bs=1M count=1024 1024+0 records in 1024+0 records out 1073741824 bytes (1.1 GB) copied, 90.1843 s, 11.9 MB/s # echo 3 > /proc/sys/vm/drop_caches # dd if=test.file of=/dev/null 2097152+0 records in 2097152+0 records out 1073741824 bytes (1.1 GB) copied, 3.94715 s, 272 MB/s # hdparm -tT /dev/vda /dev/vda: Timing cached reads: 17322 MB in 2.00 seconds = 8673.49 MB/sec Timing buffered disk reads: 996 MB in 3.00 seconds = 331.97 MB/sec #bonnie++ -d . -s 8G -n 0 -m pre-glapi -f -b -u root Version 1.97 ------Sequential Output------ --Sequential Input- --Random- Concurrency 1 -Per Chr- --Block-- -Rewrite- -Per Chr- --Block-- --Seeks-- Machine Size K/sec %CP K/sec %CP K/sec %CP K/sec %CP K/sec %CP /sec %CP pre-glapi 8G 196245 30 105331 15 962775 49 1638 34 Latency 1578ms 1383ms 201ms 301ms Version 1.97 ------Sequential Output------ --Sequential Input- --Random- Concurrency 1 -Per Chr- --Block-- -Rewrite- -Per Chr- --Block-- --Seeks-- Machine Size K/sec %CP K/sec %CP K/sec %CP K/sec %CP K/sec %CP /sec %CP pre-glapi 8G 155937 27 102899 14 1030285 54 1763 45 Latency 694ms 1333ms 114ms 229ms (note, sequential reads seem to have been influenced by caching somewhere…) After switching to gfapi: # dd if=/dev/urandom of=test.file bs=1M count=1024 1024+0 records in 1024+0 records out 1073741824 bytes (1.1 GB) copied, 80.8317 s, 13.3 MB/s # echo 3 > /proc/sys/vm/drop_caches # dd if=test.file of=/dev/null 2097152+0 records in 2097152+0 records out 1073741824 bytes (1.1 GB) copied, 3.3473 s, 321 MB/s # hdparm -tT /dev/vda /dev/vda: Timing cached reads: 17112 MB in 2.00 seconds = 8568.86 MB/sec Timing buffered disk reads: 1406 MB in 3.01 seconds = 467.70 MB/sec #bonnie++ -d . -s 8G -n 0 -m glapi -f -b -u root Version 1.97 ------Sequential Output------ --Sequential Input- --Random- Concurrency 1 -Per Chr- --Block-- -Rewrite- -Per Chr- --Block-- --Seeks-- Machine Size K/sec %CP K/sec %CP K/sec %CP K/sec %CP K/sec %CP /sec %CP glapi 8G 359100 59 185289 24 489575 31 2079 67 Latency 160ms 355ms 36041us 185ms Version 1.97 ------Sequential Output------ --Sequential Input- --Random- Concurrency 1 -Per Chr- --Block-- -Rewrite- -Per Chr- --Block-- --Seeks-- Machine Size K/sec %CP K/sec %CP K/sec %CP K/sec %CP K/sec %CP /sec %CP glapi 8G 341307 57 180546 24 472572 35 2655 61 Latency 153ms 394ms 101ms 116ms So excellent improvement in write throughput, but the significant improvement in latency is what was most noticed by users. Anecdotal reports of 2x+ performance improvements, with one remarking that it’s like having dedicated disks :) This system is on my production cluster, so it’s not getting exclusive disk access, but this VM is not doing anything else itself. The cluster is 3 xeon E5-2609 v3 @ 1.90GHz servers w/ 64G ram, SATA2 disks; 2 with 9x spindles each, 1 with 8x slightly faster disks (all spinners). Using ZFS stripes with lz4 compression and 10G connectivity to 8 hosts. Running gluster 3.12.3 at the moment. The cluster itself has about 70 running VMs in varying states of switching to gfapi use, but my main sql servers are using their own volumes and not competing for this one. These have not yet had the spectre/meltdown patches applied. This will be skewed because I forced it to not steal all the ram on the server (reads will certainly be cached), but an idea of what it can do disk wise, on the volume used above: # bonnie++ -d . -s 8G -n 0 -m zfs-server -f -b -u root -r 4096 Version 1.97 ------Sequential Output------ --Sequential Input- --Random- Concurrency 1 -Per Chr- --Block-- -Rewrite- -Per Chr- --Block-- --Seeks-- Machine Size K/sec %CP K/sec %CP K/sec %CP K/sec %CP K/sec %CP /sec %CP zfs-server 8G 604940 79 510410 87 1393862 99 3164 91 Latency 99545us 100ms 247us 152ms Just for fun from one of the servers showing base load and this testing:  ——————————————————————————
|
_______________________________________________
Gluster-users mailing list
Gluster-users@xxxxxxxxxxx
http://lists.gluster.org/mailman/listinfo/gluster-users
