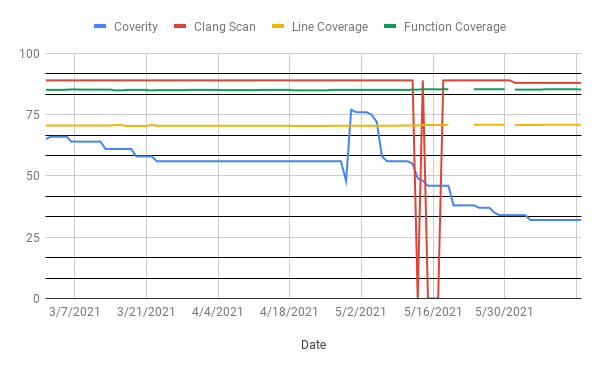
The Y-axis is for the count, the graph shows downward trend since the warnings are getting reduced.
You can check details in the coverity link provided below the graph.
If you want to see the historical data from inception, please see the link - https://scan6.coverity.com/reports.htm#v46218/p10714
Hope this helps.
Thanks
Saju
Saju
On Mon, Jun 14, 2021 at 9:30 AM sankarshan <sankarshan.mukhopadhyay@xxxxxxxxx> wrote:
-------The Coverity trend line seems to have fallen off a cliff in recent months - what would be causing this?On Mon, 14 Jun 2021 at 08:03, <sajmoham@xxxxxxxxxx> wrote:Gluster Code Metrics
Metrics Values Clang Scan 88 Coverity 32 Line Cov 70.8 % Func Cov 85.2 % Trend Graph

Check the latest run:
Coverity Clang Code Coverage--
Community Meeting Calendar:
Schedule -
Every 2nd and 4th Tuesday at 14:30 IST / 09:00 UTC
Bridge: https://meet.google.com/cpu-eiue-hvk
Gluster-devel mailing list
Gluster-devel@xxxxxxxxxxx
https://lists.gluster.org/mailman/listinfo/gluster-devel
-------

Community Meeting Calendar:
Schedule -
Every 2nd and 4th Tuesday at 14:30 IST / 09:00 UTC
Bridge: https://meet.google.com/cpu-eiue-hvk

Gluster-devel mailing list
Gluster-devel@xxxxxxxxxxx
https://lists.gluster.org/mailman/listinfo/gluster-devel
