Hi Chris,
Answering here (partially to cover Michal's questions further down the
thread as well.
On Thu, 9 Apr 2020 11:50:48 Chris Down <chris@xxxxxxxxxxxxxx> wrote:
> Hi Bruno,
>
> Bruno Prémont writes:
> >Upgrading from 5.1 kernel to 5.6 kernel on a production system using
> >cgroups (v2) and having backup process in a memory.high=2G cgroup
> >sees backup being highly throttled (there are about 1.5T to be
> >backuped).
>
> Before 5.4, memory usage with memory.high=N is essentially unbounded if the
> system is not able to reclaim pages for some reason. This is because all
> memory.high throttling before that point is just based on forcing direct
> reclaim for a cgroup, but there's no guarantee that we can actually reclaim
> pages, or that it will serve as a time penalty.
>
> In 5.4, my patch 0e4b01df8659 ("mm, memcg: throttle allocators when failing
> reclaim over memory.high") changes kernel behaviour to actively penalise
> cgroups exceeding their memory.high by a large amount. That is, if reclaim
> fails to reclaim pages and bring the cgroup below the high threshold, we
> actively deschedule the process running for some number of jiffies that is
> exponential to the amount of overage incurred. This is so that cgroups using
> memory.high cannot simply have runaway memory usage without any consequences.
Thanks for the background-information!
> This is the patch that I'd particularly suspect is related to your problem.
> However:
>
> >Most memory usage in that cgroup is for file cache.
> >
> >Here are the memory details for the cgroup:
> >memory.current:2147225600
> >[...]
> >memory.events:high 423774
> >memory.events:max 31131
> >memory.high:2147483648
> >memory.max:2415919104
>
> Your high limit is being exceeded heavily and you are failing to reclaim. You
> have `max` events here, which mean your application is at least at some point
> using over 268 *mega*bytes over its memory.high.
>
> So yes, we will penalise this cgroup heavily since we cannot reclaim from it.
> The real question is why we can't reclaim from it :-)
That's the great question!
> >memory.low:33554432
>
> You have a memory.low set, which will bias reclaim away from this cgroup based
> on overage. It's not very large, though, so it shouldn't change the semantics
> here, although it's worth noting since it also changed in another one of my
> patches, 9783aa9917f8 ("mm, memcg: proportional memory.{low,min} reclaim"),
> which is also in 5.4.
>
> In 5.1, as soon as you exceed memory.low, you immediately lose all protection.
> This is not ideal because it results in extremely binary, back-and-forth
> behaviour for cgroups using it (see the changelog for more information). This
> change means you will still receive some small amount of protection based on
> your overage, but it's fairly insignificant in this case (memory.current is
> about 64x larger than memory.low). What did you intend to do with this in 5.1?
> :-)
Well my intent was that it should have access to this low amount to
perform its work (e.g. for anonymous memory and active file [code and
minimal payload]) when rest of system is using its allowed but not
granted memory resources up to global system limits.
So feels like your patch made this promise better enforced.
> >memory.stat:anon 10887168
> >memory.stat:file 2062102528
> >memory.stat:kernel_stack 73728
> >memory.stat:slab 76148736
> >memory.stat:sock 360448
> >memory.stat:shmem 0
> >memory.stat:file_mapped 12029952
> >memory.stat:file_dirty 946176
> >memory.stat:file_writeback 405504
> >memory.stat:anon_thp 0
> >memory.stat:inactive_anon 0
> >memory.stat:active_anon 10121216
> >memory.stat:inactive_file 1954959360
> >memory.stat:active_file 106418176
> >memory.stat:unevictable 0
> >memory.stat:slab_reclaimable 75247616
> >memory.stat:slab_unreclaimable 901120
> >memory.stat:pgfault 8651676
> >memory.stat:pgmajfault 2013
> >memory.stat:workingset_refault 8670651
> >memory.stat:workingset_activate 409200
> >memory.stat:workingset_nodereclaim 62040
> >memory.stat:pgrefill 1513537
> >memory.stat:pgscan 47519855
> >memory.stat:pgsteal 44933838
> >memory.stat:pgactivate 7986
> >memory.stat:pgdeactivate 1480623
> >memory.stat:pglazyfree 0
> >memory.stat:pglazyfreed 0
> >memory.stat:thp_fault_alloc 0
> >memory.stat:thp_collapse_alloc 0
>
> Hard to say exactly why we can't reclaim using these statistics, usually if
> anything the kernel is *over* eager to drop cache pages than anything.
>
> If the kernel thinks those file pages are too hot, though, it won't drop them.
> However, we only have 106M active file, compared to 2GB memory.current, so it
> doesn't look like this is the issue.
>
> Can you please show io.pressure, io.stat, and cpu.pressure during these periods
> compared to baseline for this cgroup and globally (from /proc/pressure)? My
> suspicion is that we are not able to reclaim fast enough because memory
> management is getting stuck behind a slow disk.
Disk should not be too slow at writing (SAN for most of the data,
local, battery-backed RAID for logs)
System's IO pressure is low (below 1 except for some random peaks going
to 20)
System's CPU pressure is similar (spikes happen at unrelated times)
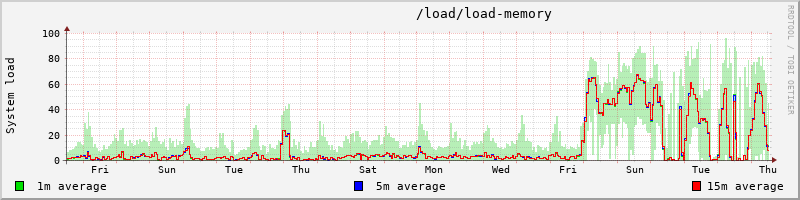
System's Memory pressure though most often is high.
Prior to kernel update is was mostly in 5-10 (short-term value with
periods of spiking around 20), while long-term value remained below 5.
Since kernel upgrade things changed quite a lot:
Sometimes memory pressure is low but it's mostly ranging between 40 and
80.
I guess attached PNG will give you a better idea than any textual
explanation. (reboot for kernel upgrade happened during night from
Friday to Saturday about midnight).
Digging some deeper in the (highly affected) cg hierarchy:
CGv2:
+ workload
| | ....
+ system
| base (has init, ntp and the like system daemons)
| shell (has tty gettys, ssh and the like)
| backup (has backup processes only)
system/:
memory.current:8589053952
memory.high:8589934592
memory.low:134217728
memory.max:9663676416
memory.events:low 0
memory.events:high 441886
memory.events:max 31131
memory.events:oom 0
memory.events:oom_kill 0
memory.stat:file 8346779648
memory.stat:file_mapped 105971712
memory.stat:file_dirty 2838528
memory.stat:file_writeback 1486848
memory.stat:inactive_file 6600683520
memory.stat:active_file 1067331584
system/base:
memory.current:7789477888
memory.high:max
memory.low:0
memory.max:max
memory.events:low 0
memory.events:high 0
memory.events:max 0
memory.events:oom 0
memory.events:oom_kill 0
memory.stat:file 7586832384
memory.stat:file_mapped 92995584
memory.stat:file_dirty 1351680
memory.stat:file_writeback 1081344
memory.stat:inactive_file 6592962560
memory.stat:active_file 946053120
system/shell:
memory.current:638394368
memory.high:max
memory.low:0
memory.max:max
memory.events:low 0
memory.events:high 0
memory.events:max 0
memory.events:oom 0
memory.events:oom_kill 0
memory.stat:file 637349888
memory.stat:file_mapped 2568192
memory.stat:file_dirty 405504
memory.stat:file_writeback 0
memory.stat:inactive_file 3645440
memory.stat:active_file 6991872
system/backup:
memory.current:160874496
memory.high:2147483648
memory.low:33554432
memory.max:2415919104
memory.events:low 0
memory.events:high 425240
memory.events:max 31131
memory.events:oom 0
memory.events:oom_kill 0
memory.stat:file 122687488
memory.stat:file_mapped 10678272
memory.stat:file_dirty 675840
memory.stat:file_writeback 405504
memory.stat:inactive_file 10416128
memory.stat:active_file 110329856
For tasks being throttled /proc/$pid/stack shows
[<0>] mem_cgroup_handle_over_high+0x121/0x170
[<0>] exit_to_usermode_loop+0x67/0xa0
[<0>] do_syscall_64+0x149/0x170
[<0>] entry_SYSCALL_64_after_hwframe+0x44/0xa9
It even hits my shell running over ssh. Turns out that for now (as
backup processes had been restarted and run mostly smoothly at the
moment) now the throttling happens caused by parent system/ cgroup
which reached high with tons of inactive file cache.
Note: under workload there is a task running through whole SAN disk
file try counting file sizes at hourly interval, thus keeping most
inodes at least partially active
Major workload is a webserver (serving static files and running
PHP based CMSs)
> Swap availability and usage information would also be helpful.
There is no swap.
> >Regularly the backup process seems to be blocked for about 2s, but not
> >within a syscall according to strace.
>
> 2 seconds is important, it's the maximum time we allow the allocator throttler
> to throttle for one allocation :-)
>
> If you want to verify, you can look at /proc/pid/stack during these stalls --
> they should be in mem_cgroup_handle_over_high, in an address related to
> allocator throttling.
Yes, I've seen that (see above).
> >Is there a way to tell kernel that this cgroup should not be throttled
>
> Huh? That's what memory.high is for, so why are you using if it you don't want
> that?
Well, remainder of sentence is the important part.
The cgroup is expected to have short-lived cache usage and thus caches
should not be a reason for throttling.
> >and its inactive file cache given up (rather quickly).
>
> I suspect the kernel is reclaiming as far as it can, but is being stopped from
> doing so for some reason, which is why I'd like to see io.pressure and
> cpu.pressure.
io.pressure:some avg10=0.17 avg60=0.35 avg300=0.37 total=6479904094
io.pressure:full avg10=0.16 avg60=0.32 avg300=0.33 total=6363939615
backup/io.pressure:some avg10=0.00 avg60=0.00 avg300=0.00 total=3600665286
backup/io.pressure:full avg10=0.00 avg60=0.00 avg300=0.00 total=3580320436
base/io.pressure:some avg10=0.26 avg60=0.40 avg300=0.38 total=4584357682
base/io.pressure:full avg10=0.25 avg60=0.37 avg300=0.35 total=4512115687
shell/io.pressure:some avg10=0.00 avg60=0.00 avg300=0.00 total=7337275
shell/io.pressure:full avg10=0.00 avg60=0.00 avg300=0.00 total=7329137
That's low I would say.
> >On a side note, I liked v1's mode of soft/hard memory limit where the
> >memory amount between soft and hard could be used if system has enough
> >free memory. For v2 the difference between high and max seems almost of
> >no use.
>
> For that use case, that's more or less what we've designed memory.low to do.
> The difference is that v1's soft limit almost never worked: the heuristics are
> extremely complicated, so complicated in fact that even we as memcg maintainers
> cannot reason about them. If we cannot reason about them, I'm quite sure it's
> not really doing what you expect :-)
Well, memory.low is great for workload, but not really for backup which should
not "pollute" system's file cache (about same issue as logs which are almost
write-only but still tend to fill file cache throwing out).
> In this case everything looks like it's working as intended, just this is all
> the result of memory.high becoming less broken in 5.4. From your description,
> I'm not sure that memory.high is what you want, either.
>
> >A cgroup parameter for impacting RO file cache differently than
> >anonymous memory or otherwise dirty memory would be great too.
>
> We had vm.swappiness in v1 and it manifested extremely poorly. I won't go too
> much into the details of that here though, since we already discussed it fairly
> comprehensively here[0].
>
> Please feel free to send over the io.pressure, io.stat, cpu.pressure, and swap
> metrics at baseline and during this when possible. Thanks!
Current system-wide pressure metrics:
/proc/pressure/cpu:some avg10=0.05 avg60=0.08 avg300=0.07 total=965407160
/proc/pressure/io:some avg10=0.00 avg60=0.02 avg300=0.04 total=5674971954
/proc/pressure/io:full avg10=0.00 avg60=0.02 avg300=0.04 total=5492982327
/proc/pressure/memory:some avg10=33.21 avg60=21.28 avg300=21.06 total=166513106563
/proc/pressure/memory:full avg10=32.09 avg60=20.23 avg300=20.13 total=158792995733
In the end the big question is why do the large amounts of inactive file caches
survive reclaim and thus cause cgroups to get starved.
> 0: https://lore.kernel.org/patchwork/patch/1172080/
Thanks,
Bruno
Attachment:
MemoryPressure_.png
Description: PNG image
