|
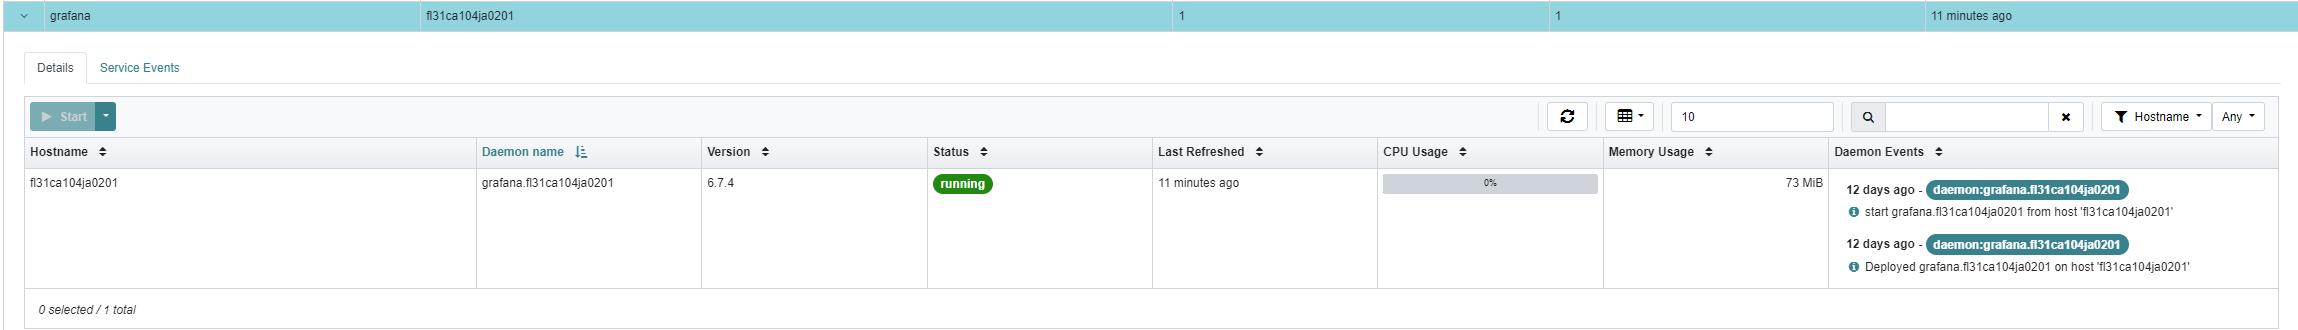
Hi Eugene, Thank you for your response, here is the update. The upgrade to Quincy was done following the cephadm orch upgrade procedure ceph orch upgrade start --image quay.io/ceph/ceph:v17.2.6 Upgrade completed with out errors. After the upgrade, upon creating the Grafana service from Ceph dashboard, it deployed Grafana 6.7.4. The version is hardcoded in the code, should it not be 8.3.5 as listed below in Quincy documentation?
See below
Quincy documentation states:
https://docs.ceph.com/en/latest/releases/quincy/ ……documentation snippet Monitoring and alerting: 43 new alerts have been added (totalling 68) improving observability of events affecting: cluster health, monitors, storage devices, PGs and CephFS. Alerts can now be sent externally as SNMP traps via the new SNMP gateway service (the MIB is provided). Improved integrated full/nearfull event notifications. Grafana Dashboards now use grafonnet format (though they’re still available in JSON format). Stack update: images for monitoring containers have been updated.
Grafana 8.3.5, Prometheus 2.33.4, Alertmanager 0.23.0 and Node Exporter 1.3.1. This reduced exposure to several Grafana vulnerabilities (CVE-2021-43798, CVE-2021-39226, CVE-2021-43798, CVE-2020-29510, CVE-2020-29511). …………………. I notice that the versions of the remaining stack, that Ceph dashboard deploys, are also older than what is documented. Prometheus 2.7.2, Alertmanager 0.16.2 and Node Exporter 0.17.0. AND 6.7.4 Grafana service reports a few warnings: highlighted below root@fl31ca104ja0201:/home/general# systemctl status ceph-d0a3b6e0-d2c3-11ed-be05-a7a3a1d7a87e@grafana.fl31ca104ja0201.service ● ceph-d0a3b6e0-d2c3-11ed-be05-a7a3a1d7a87e@grafana.fl31ca104ja0201.service - Ceph grafana.fl31ca104ja0201 for d0a3b6e0-d2c3-11ed-be05-a7a3a1d7a87e Loaded: loaded (/etc/systemd/system/ceph-d0a3b6e0-d2c3-11ed-be05-a7a3a1d7a87e@.service; enabled; vendor preset: enabled) Active: active (running) since Tue 2023-06-13 03:37:58 UTC; 11h ago Main PID: 391896 (bash) Tasks: 53 (limit: 618607) Memory: 17.9M CGroup: /system.slice/system-ceph\x2dd0a3b6e0\x2dd2c3\x2d11ed\x2dbe05\x2da7a3a1d7a87e.slice/ceph-d0a3b6e0-d2c3-11ed-be05-a7a3a1d7a87e@grafana.fl31ca104j> ├─391896 /bin/bash /var/lib/ceph/d0a3b6e0-d2c3-11ed-be05-a7a3a1d7a87e/grafana.fl31ca104ja0201/unit.run └─391969 /usr/bin/docker run --rm --ipc=host --stop-signal=SIGTERM --net=host --init --name ceph-d0a3b6e0-d2c3-11ed-be05-a7a3a1d7a87e-grafana-fl> -- Logs begin at Sun 2023-06-11 20:41:51 UTC, end at Tue 2023-06-13 15:35:12 UTC. -- Jun 13 03:37:59 fl31ca104ja0201 bash[391969]: t=2023-06-13T03:37:59+0000 lvl=info msg="Executing migration" logger=migrator id="alter user_auth.auth_id to length 190" Jun 13 03:37:59 fl31ca104ja0201 bash[391969]: t=2023-06-13T03:37:59+0000 lvl=info msg="Executing migration" logger=migrator id="Add OAuth access token to user_auth" Jun 13 03:37:59 fl31ca104ja0201 bash[391969]: t=2023-06-13T03:37:59+0000 lvl=info msg="Executing migration" logger=migrator id="Add OAuth refresh token to user_auth" Jun 13 03:37:59 fl31ca104ja0201 bash[391969]: t=2023-06-13T03:37:59+0000 lvl=info msg="Executing migration" logger=migrator id="Add OAuth token type to user_auth" Jun 13 03:37:59 fl31ca104ja0201 bash[391969]: t=2023-06-13T03:37:59+0000 lvl=info msg="Executing migration" logger=migrator id="Add OAuth expiry to user_auth" Jun 13 03:37:59 fl31ca104ja0201 bash[391969]: t=2023-06-13T03:37:59+0000 lvl=info msg="Executing migration" logger=migrator id="Add index to user_id column in user_auth" Jun 13 03:37:59 fl31ca104ja0201 bash[391969]: t=2023-06-13T03:37:59+0000 lvl=info msg="Executing migration" logger=migrator id="create server_lock table" Jun 13 03:37:59 fl31ca104ja0201 bash[391969]: t=2023-06-13T03:37:59+0000 lvl=info msg="Executing migration" logger=migrator id="add index server_lock.operation_uid" Jun 13 03:37:59 fl31ca104ja0201 bash[391969]: t=2023-06-13T03:37:59+0000 lvl=info msg="Executing migration" logger=migrator id="create user auth token table" Jun 13 03:37:59 fl31ca104ja0201 bash[391969]: t=2023-06-13T03:37:59+0000 lvl=info msg="Executing migration" logger=migrator id="add unique index user_auth_token.auth_token" Jun 13 03:37:59 fl31ca104ja0201 bash[391969]: t=2023-06-13T03:37:59+0000 lvl=info msg="Executing migration" logger=migrator id="add unique index user_auth_token.prev_auth_token" Jun 13 03:37:59 fl31ca104ja0201 bash[391969]: t=2023-06-13T03:37:59+0000 lvl=info msg="Executing migration" logger=migrator id="create cache_data table" Jun 13 03:37:59 fl31ca104ja0201 bash[391969]: t=2023-06-13T03:37:59+0000 lvl=info msg="Executing migration" logger=migrator id="add unique index cache_data.cache_key" Jun 13 03:37:59 fl31ca104ja0201 bash[391969]: t=2023-06-13T03:37:59+0000 lvl=info msg="Created default organization" logger=sqlstore Jun 13 03:37:59 fl31ca104ja0201 bash[391969]: t=2023-06-13T03:37:59+0000 lvl=info msg="Initializing HTTPServer" logger=server Jun 13 03:37:59 fl31ca104ja0201 bash[391969]: t=2023-06-13T03:37:59+0000 lvl=info msg="Initializing BackendPluginManager" logger=server Jun 13 03:37:59 fl31ca104ja0201 bash[391969]: t=2023-06-13T03:37:59+0000 lvl=info msg="Initializing PluginManager" logger=server Jun 13 03:37:59 fl31ca104ja0201 bash[391969]: t=2023-06-13T03:37:59+0000 lvl=info msg="Starting plugin search" logger=plugins Jun 13 03:37:59 fl31ca104ja0201 bash[391969]: t=2023-06-13T03:37:59+0000 lvl=info msg="Initializing HooksService" logger=server Jun 13 03:37:59 fl31ca104ja0201 bash[391969]: t=2023-06-13T03:37:59+0000 lvl=info msg="Initializing OSSLicensingService" logger=server Jun 13 03:37:59 fl31ca104ja0201 bash[391969]: t=2023-06-13T03:37:59+0000 lvl=info msg="Initializing InternalMetricsService" logger=server Jun 13 03:37:59 fl31ca104ja0201 bash[391969]: t=2023-06-13T03:37:59+0000 lvl=info msg="Initializing RemoteCache" logger=server Jun 13 03:37:59 fl31ca104ja0201 bash[391969]: t=2023-06-13T03:37:59+0000 lvl=info msg="Initializing RenderingService" logger=server Jun 13 03:37:59 fl31ca104ja0201 bash[391969]: t=2023-06-13T03:37:59+0000 lvl=info msg="Initializing AlertEngine" logger=server Jun 13 03:37:59 fl31ca104ja0201 bash[391969]: t=2023-06-13T03:37:59+0000 lvl=info msg="Initializing QuotaService" logger=server Jun 13 03:37:59 fl31ca104ja0201 bash[391969]: t=2023-06-13T03:37:59+0000 lvl=info msg="Initializing ServerLockService" logger=server Jun 13 03:37:59 fl31ca104ja0201 bash[391969]: t=2023-06-13T03:37:59+0000 lvl=info msg="Initializing UserAuthTokenService" logger=server Jun 13 03:37:59 fl31ca104ja0201 bash[391969]: t=2023-06-13T03:37:59+0000 lvl=info msg="Initializing DatasourceCacheService" logger=server Jun 13 03:37:59 fl31ca104ja0201 bash[391969]: t=2023-06-13T03:37:59+0000 lvl=info msg="Initializing LoginService" logger=server Jun 13 03:37:59 fl31ca104ja0201 bash[391969]: t=2023-06-13T03:37:59+0000 lvl=info msg="Initializing SearchService" logger=server Jun 13 03:37:59 fl31ca104ja0201 bash[391969]: t=2023-06-13T03:37:59+0000 lvl=info msg="Initializing TracingService" logger=server Jun 13 03:37:59 fl31ca104ja0201 bash[391969]: t=2023-06-13T03:37:59+0000 lvl=info msg="Initializing UsageStatsService" logger=server Jun 13 03:37:59 fl31ca104ja0201 bash[391969]: t=2023-06-13T03:37:59+0000 lvl=info msg="Initializing CleanUpService" logger=server Jun 13 03:37:59 fl31ca104ja0201 bash[391969]: t=2023-06-13T03:37:59+0000 lvl=info msg="Initializing NotificationService" logger=server Jun 13 03:37:59 fl31ca104ja0201 bash[391969]: t=2023-06-13T03:37:59+0000 lvl=info msg="Initializing provisioningServiceImpl" logger=server Jun 13 03:37:59 fl31ca104ja0201 bash[391969]: t=2023-06-13T03:37:59+0000 lvl=warn msg="[Deprecated] the datasource provisioning config is outdated. please upgrade" logger=provisioning.datasources
filename=/etc/grafana/provisioning/datasources/ceph-dashboard.yml This warning comes due to the missing “
apiVersion: 1” first line entry in /etc/grafana/provisioning/datasources/ceph-dashboard.yml created by cephadm. If the file is modified to include the apiversion line and restart Grafana service,
Is this a known ISSUE ? Here is the content of the
ceph-dashboard.yml produced by cephadm deleteDatasources: - name: 'Dashboard1' orgId: 1 - name: 'Loki' orgId: 2 datasources: - name: 'Dashboard1' type: 'prometheus' access: 'proxy' orgId: 1 url: 'http://fl31ca104ja0201.xxx.xxx.com:9095' basicAuth: false isDefault: true editable: false - name: 'Loki' type: 'loki' access: 'proxy' orgId: 2 url: '' basicAuth: false isDefault: true editable: false -------------------------------------------------------------- Jun 13 03:37:59 fl31ca104ja0201 bash[391969]: t=2023-06-13T03:37:59+0000 lvl=info msg="inserting datasource from configuration " logger=provisioning.datasources name=Dashboard1 Jun 13 03:37:59 fl31ca104ja0201 bash[391969]: t=2023-06-13T03:37:59+0000 lvl=info msg="inserting datasource from configuration " logger=provisioning.datasources name=Loki Jun 13 03:37:59 fl31ca104ja0201 bash[391969]: t=2023-06-13T03:37:59+0000 lvl=info msg="Backend rendering via phantomJS" logger=rendering renderer=phantomJS Jun 13 03:37:59 fl31ca104ja0201 bash[391969]: t=2023-06-13T03:37:59+0000 lvl=warn msg="phantomJS is deprecated and will be removed in a future release. You should consider migrating from phantomJS to grafana-image-renderer plugin. Read
more at
https://grafana.com/docs/grafana/latest/administration/image_rendering/" logger=rendering renderer=phantomJS Jun 13 03:37:59 fl31ca104ja0201 bash[391969]: t=2023-06-13T03:37:59+0000 lvl=info msg="Initializing Stream Manager" Jun 13 03:37:59 fl31ca104ja0201 bash[391969]: t=2023-06-13T03:37:59+0000 lvl=info msg="HTTP Server Listen" logger=http.server address=[::]:3000 protocol=https subUrl= socket= I also had to change a few other things to keep all the services running. The last issue that I have not been able to resolve yet is the Cephbash board gives this error even though grafana is running on the same server. However, the grafana
dashboard cannot be accessed without tunnelling.
|

_______________________________________________
ceph-users mailing list -- ceph-users@xxxxxxx
To unsubscribe send an email to ceph-users-leave@xxxxxxx
