|
Please include your promtai; logs, loki logs, promtail configuration, and your loki configuration. From:
Peter van Heusden <pvh@xxxxxxxxxxx>
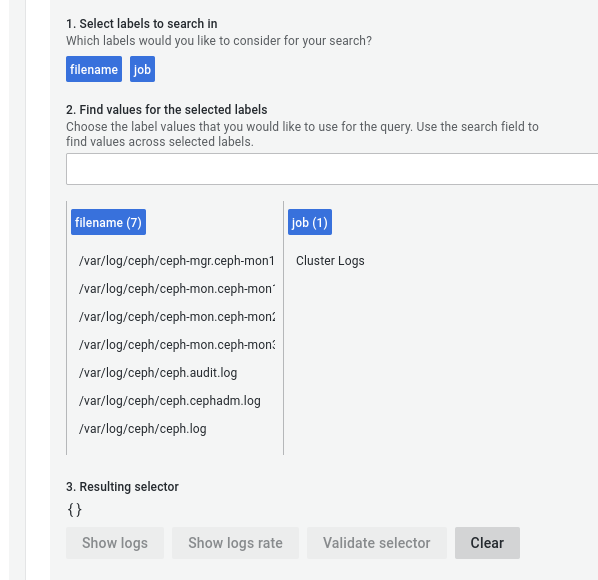
*** External email: use caution *** Hi there I am running Ceph version 17.2.5 and have deployed centralised logging as per this guide: The logs from the OSDs are not, however, showing up in the Grafana dashboard, as per this screenshot:
The Promtail daemons are running on each node including the OSDs. The Loki server and Grafana are running on one of our monitor nodes. Thanks for any clarifications you can provide. Peter The information contained in this e-mail message is intended only for the personal and confidential use of the recipient(s) named above. This message may be an attorney-client communication and/or work product and as such is privileged and confidential. If the reader of this message is not the intended recipient or an agent responsible for delivering it to the intended recipient, you are hereby notified that you have received this document in error and that any review, dissemination, distribution, or copying of this message is strictly prohibited. If you have received this communication in error, please notify us immediately by e-mail, and delete the original message. |
_______________________________________________
ceph-users mailing list -- ceph-users@xxxxxxx
To unsubscribe send an email to ceph-users-leave@xxxxxxx

