Paul,
i would like to take the chance, to thank you and ask if it could not be, that
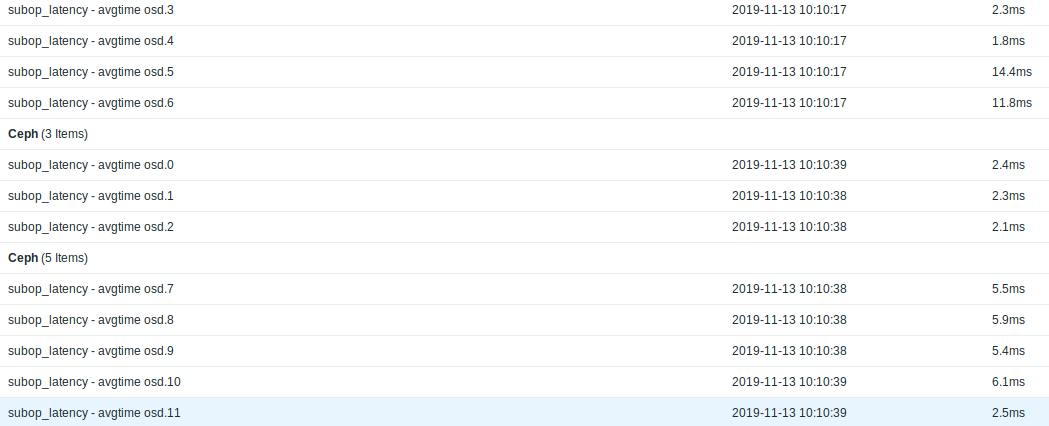
subop_latency reports high value (is that avgtime in seconds reported?)
"subop_latency": {
"avgcount": 7782673,
"sum": 38852.140794738,
"avgtime": 0.004992133
because the communication partner is slow in writing/commiting?
Dont want to follow the red hering :/
We have the following times on our 11 osds. Attached image.
-----Ursprüngliche Nachricht-----
Von: Paul Emmerich <paul.emmerich@xxxxxxxx>
Gesendet: Donnerstag 7 November 2019 19:04
An: Stefan Bauer <stefan.bauer@xxxxxxxxxxx>
CC: ceph-users@xxxxxxxxxxxxxx
Betreff: Re: how to find the lazy egg - poor performance - interesting observations [klartext]
You can have a look at subop_latency in "ceph daemon osd.XX perf
dump", it tells you how long an OSD took to reply to another OSD.
That's usually a good indicator if an OSD is dragging down others.
Or have a look at "ceph osd perf dump" which is basically disk
latency; simpler to acquire but with less information

Paul

--
Paul Emmerich

Looking for help with your Ceph cluster? Contact us at https://croit.io

croit GmbH
Freseniusstr. 31h
81247 München
www.croit.io
Tel: +49 89 1896585 90

On Thu, Nov 7, 2019 at 6:55 PM Stefan Bauer <sb@xxxxxxx> wrote:
>
> Hi folks,
>
>
> we are running a 3 node proxmox-cluster with - of corse - ceph :)
>
> ceph version 12.2.12 (39cfebf25a7011204a9876d2950e4b28aba66d11) luminous (stable)
>
>
> 10G network. iperf reports almost 10G between all nodes.
>
>
> We are using mixed standard SSDs (crucial / samsung). We are aware, that these disks can not delivery high iops or great throughput, but we have several of these clusters and this one is showing very poor performance.
>
>
> NOW the strange fact:
>
>
> When a specific node is rebooting, the throughput is acceptable.
>
>
> But when the specific node is back, the results dropped by almost 100%.
>
>
> 2 NODES (one rebooting)
>
>
> # rados bench -p scbench 10 write --no-cleanup
> hints = 1
> Maintaining 16 concurrent writes of 4194304 bytes to objects of size 4194304 for up to 10 seconds or 0 objects
> Object prefix: benchmark_data_pve3_1767693
>   sec Cur ops   started  finished  avg MB/s  cur MB/s last lat(s)  avg lat(s)
>     0       0         0         0         0         0           -           0
>     1      16        55        39   155.992       156   0.0445665    0.257988
>     2      16       110        94    187.98       220    0.087097    0.291173
>     3      16       156       140   186.645       184    0.462171    0.286895
>     4      16       184       168    167.98       112   0.0235336    0.358085
>     5      16       210       194   155.181       104    0.112401    0.347883
>     6      16       252       236   157.314       168    0.134099    0.382159
>     7      16       287       271   154.838       140   0.0264864     0.40092
>     8      16       329       313   156.481       168   0.0609964    0.394753
>     9      16       364       348   154.649       140    0.244309    0.392331
>    10      16       416       400   159.981       208    0.277489    0.387424
> Total time run:         10.335496
> Total writes made:      417
> Write size:             4194304
> Object size:            4194304
> Bandwidth (MB/sec):     161.386
> Stddev Bandwidth:       37.8065
> Max bandwidth (MB/sec): 220
> Min bandwidth (MB/sec): 104
> Average IOPS:           40
> Stddev IOPS:            9
> Max IOPS:               55
> Min IOPS:               26
> Average Latency(s):     0.396434
> Stddev Latency(s):      0.428527
> Max latency(s):         1.86968
> Min latency(s):         0.020558
>
>
>
> THIRD NODE ONLINE:
>
>
>
> root@pve3:/# rados bench -p scbench 10 write --no-cleanup
> hints = 1
> Maintaining 16 concurrent writes of 4194304 bytes to objects of size 4194304 for up to 10 seconds or 0 objects
> Object prefix: benchmark_data_pve3_1771977
>   sec Cur ops   started  finished  avg MB/s  cur MB/s last lat(s)  avg lat(s)
>     0       0         0         0         0         0           -           0
>     1      16        39        23   91.9943        92     0.21353    0.267249
>     2      16        46        30   59.9924        28     0.29527    0.268672
>     3      16        53        37   49.3271        28    0.122732    0.259731
>     4      16        53        37   36.9954         0           -    0.259731
>     5      16        53        37   29.5963         0           -    0.259731
>     6      16        87        71   47.3271   45.3333    0.241921     1.19831
>     7      16       106        90   51.4214        76    0.124821     1.07941
>     8      16       129       113    56.492        92   0.0314146    0.941378
>     9      16       142       126   55.9919        52    0.285536    0.871445
>    10      16       147       131   52.3925        20    0.354803    0.852074
> Total time run:         10.138312
> Total writes made:      148
> Write size:             4194304
> Object size:            4194304
> Bandwidth (MB/sec):     58.3924
> Stddev Bandwidth:       34.405
> Max bandwidth (MB/sec): 92
> Min bandwidth (MB/sec): 0
> Average IOPS:           14
> Stddev IOPS:            8
> Max IOPS:               23
> Min IOPS:               0
> Average Latency(s):     1.08818
> Stddev Latency(s):      1.55967
> Max latency(s):         5.02514
> Min latency(s):         0.0255947
>
>
>
> Is here a single node faulty?
>
>
>
> root@pve3:/# ceph status
>   cluster:
>     id:     138c857a-c4e6-4600-9320-9567011470d6
>     health: HEALTH_WARN
>             application not enabled on 1 pool(s) (thats just for benchmarking)
>
>   services:
>     mon: 3 daemons, quorum pve1,pve2,pve3
>     mgr: pve1(active), standbys: pve3, pve2
>     osd: 12 osds: 12 up, 12 in
>
>   data:
>     pools:   2 pools, 612 pgs
>     objects: 758.52k objects, 2.89TiB
>     usage:   8.62TiB used, 7.75TiB / 16.4TiB avail
>     pgs:     611 active+clean
>              1   active+clean+scrubbing+deep
>
>   io:
>     client:   4.99MiB/s rd, 1.36MiB/s wr, 678op/s rd, 105op/s wr
>
>
>
> Thank you.
>
>
> Stefan
>
> _______________________________________________
> ceph-users mailing list
> ceph-users@xxxxxxxxxxxxxx
> http://lists.ceph.com/listinfo.cgi/ceph-users-ceph.com
Attachment:
Bildschirmfoto vom 2019-11-13 10-11-09.png
Description: PNG image
_______________________________________________
ceph-users mailing list
ceph-users@xxxxxxxxxxxxxx
http://lists.ceph.com/listinfo.cgi/ceph-users-ceph.com
