|
Hi all, The context : - Test cluster aside production one - Fresh install on Luminous - choice of Bluestore (coming from Filestore) - Default config (including wpq queuing) - 6 nodes SAS12, 14 OSD, 2 SSD, 2 x 10Gb nodes, far more Gb at each switch uplink... - R3 pool, 2 nodes per site - separate db (25GB) and wal (600MB) partitions on SSD for each OSD to be able to observe each kind of IO with iostat - RBD client fio --ioengine=libaio --iodepth=128 --direct=1 - client RDB : rbd map rbd/test_rbd -o queue_depth=1024 - Just to point out, this is not a thread on SSD performance or adequation between SSD and number of OSD. These 12Gb SAS 10DWPD SSD are perfectly performing with lot of headroom on the production cluster even with XFS filestore and journals on SSDs. - This thread is about a possible bottleneck on low size blocks with rocksdb/wal/Bluestore. To begin with, Bluestore performance is really breathtaking compared to filestore/XFS : we saturate the 20Gb clients bandwidth on this small test cluster, as soon as IO blocksize=64k, a thing we couldn't achieve with Filestore and journals, even at 256k. The downside, all small IO blockizes (4k, 8k, 16k, 32k) are considerably slower and appear somewhat capped. Just to compare, here are observed latencies at 2 consecutive values for blocksize 64k and 32k : 64k : write: io=55563MB, bw=1849.2MB/s, iops=29586, runt= 30048msec lat (msec): min=2, max=867, avg=17.29, stdev=32.31 32k : write: io=6332.2MB, bw=207632KB/s, iops=6488, runt= 31229msec lat (msec): min=1, max=5111, avg=78.81, stdev=430.50 Whereas 64k one is almost filling the 20Gb client connection, the 32k one is only getting a mere 1/10th of the bandwidth, and IOs latencies are multiplied by 4.5 (or get a ~60ms pause ? ... ) And we see the same constant latency at 16k, 8k and 4k : 16k : write: io=3129.4MB, bw=102511KB/s, iops=6406, runt= 31260msec lat (msec): min=0.908, max=6.67, avg=79.87, stdev=500.08 8k : write: io=1592.8MB, bw=52604KB/s, iops=6575, runt= 31005msec lat (msec): min=0.824, max=5.49, avg=77.82, stdev=461.61 4k : write: io=837892KB, bw=26787KB/s, iops=6696, runt= 31280msec lat (msec): min=0.766, max=5.45, avg=76.39, stdev=428.29 To compare with filestore, on 4k IOs results I have on hand from previous install, we were getting almost 2x the Bluestore perfs on the exact same cluster : WRITE: io=1221.4MB, aggrb=41477KB/,s maxt=30152msec The thing is during these small blocksize fio benchmarks, nowhere nodes CPU, OSD, SSD, or of course network are saturated (ie. I think this has nothing to do with write amplification), nevertheless clients IOPS starve at low values. Shouldn't Bluestore IOPs be far higher than Filestore on small IOs too ? To summerize, here is what we can observe : 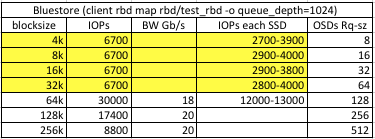 Seeking counters, I found in "perf dump" incrementing values with slow IO benchs, here for 1 run of 4k fio : "deferred_write_ops": 7631, "deferred_write_bytes": 31457280, Does this means throttling or other QoS mechanism may be the cause and default config values may be artificially limiting small IO performance on our architecture ? And has anyone an idea on how to circumvent it ? OSD Config Reference documentation may be talking about these aspects in the QoS/MClock/Caveats section, but I'm not sure to understand the whole picture. Could someone help ? Thanks Frederic |
_______________________________________________
ceph-users mailing list
ceph-users@xxxxxxxxxxxxxx
http://lists.ceph.com/listinfo.cgi/ceph-users-ceph.com
