Today, the MGLRU debugfs interface (/sys/kernel/debug/lru_gen) provides
a histogram counting the number of pages belonging to each generation,
providing some data for memory coldness, but we don't actually know
where the memory actually is. However, since MGLRU revamps the page
reclaim mechanism to walk page tables, we can hook into MGLRU page table
access bit harvesting with a BPF program to collect information on
relative hotness and coldness, NUMA nodes, whether a page is anon/file,
etc.
Using BPF programs to collect and aggregate page access information
allows for the userspace agent to customize what to collect and how to
aggregate. It could focus on a particular region of interest and count a
moving average access frequency, or find allocations that are never
accessed that could be eliminated all together. Currently MGLRU relies
on heuristics with regards to what generation a page is assigned, for
example, pages accessed through page tables are always assigned to the
youngest generation. Exposing page access data can allow future work to
customize page generation assignments (with more BPF).
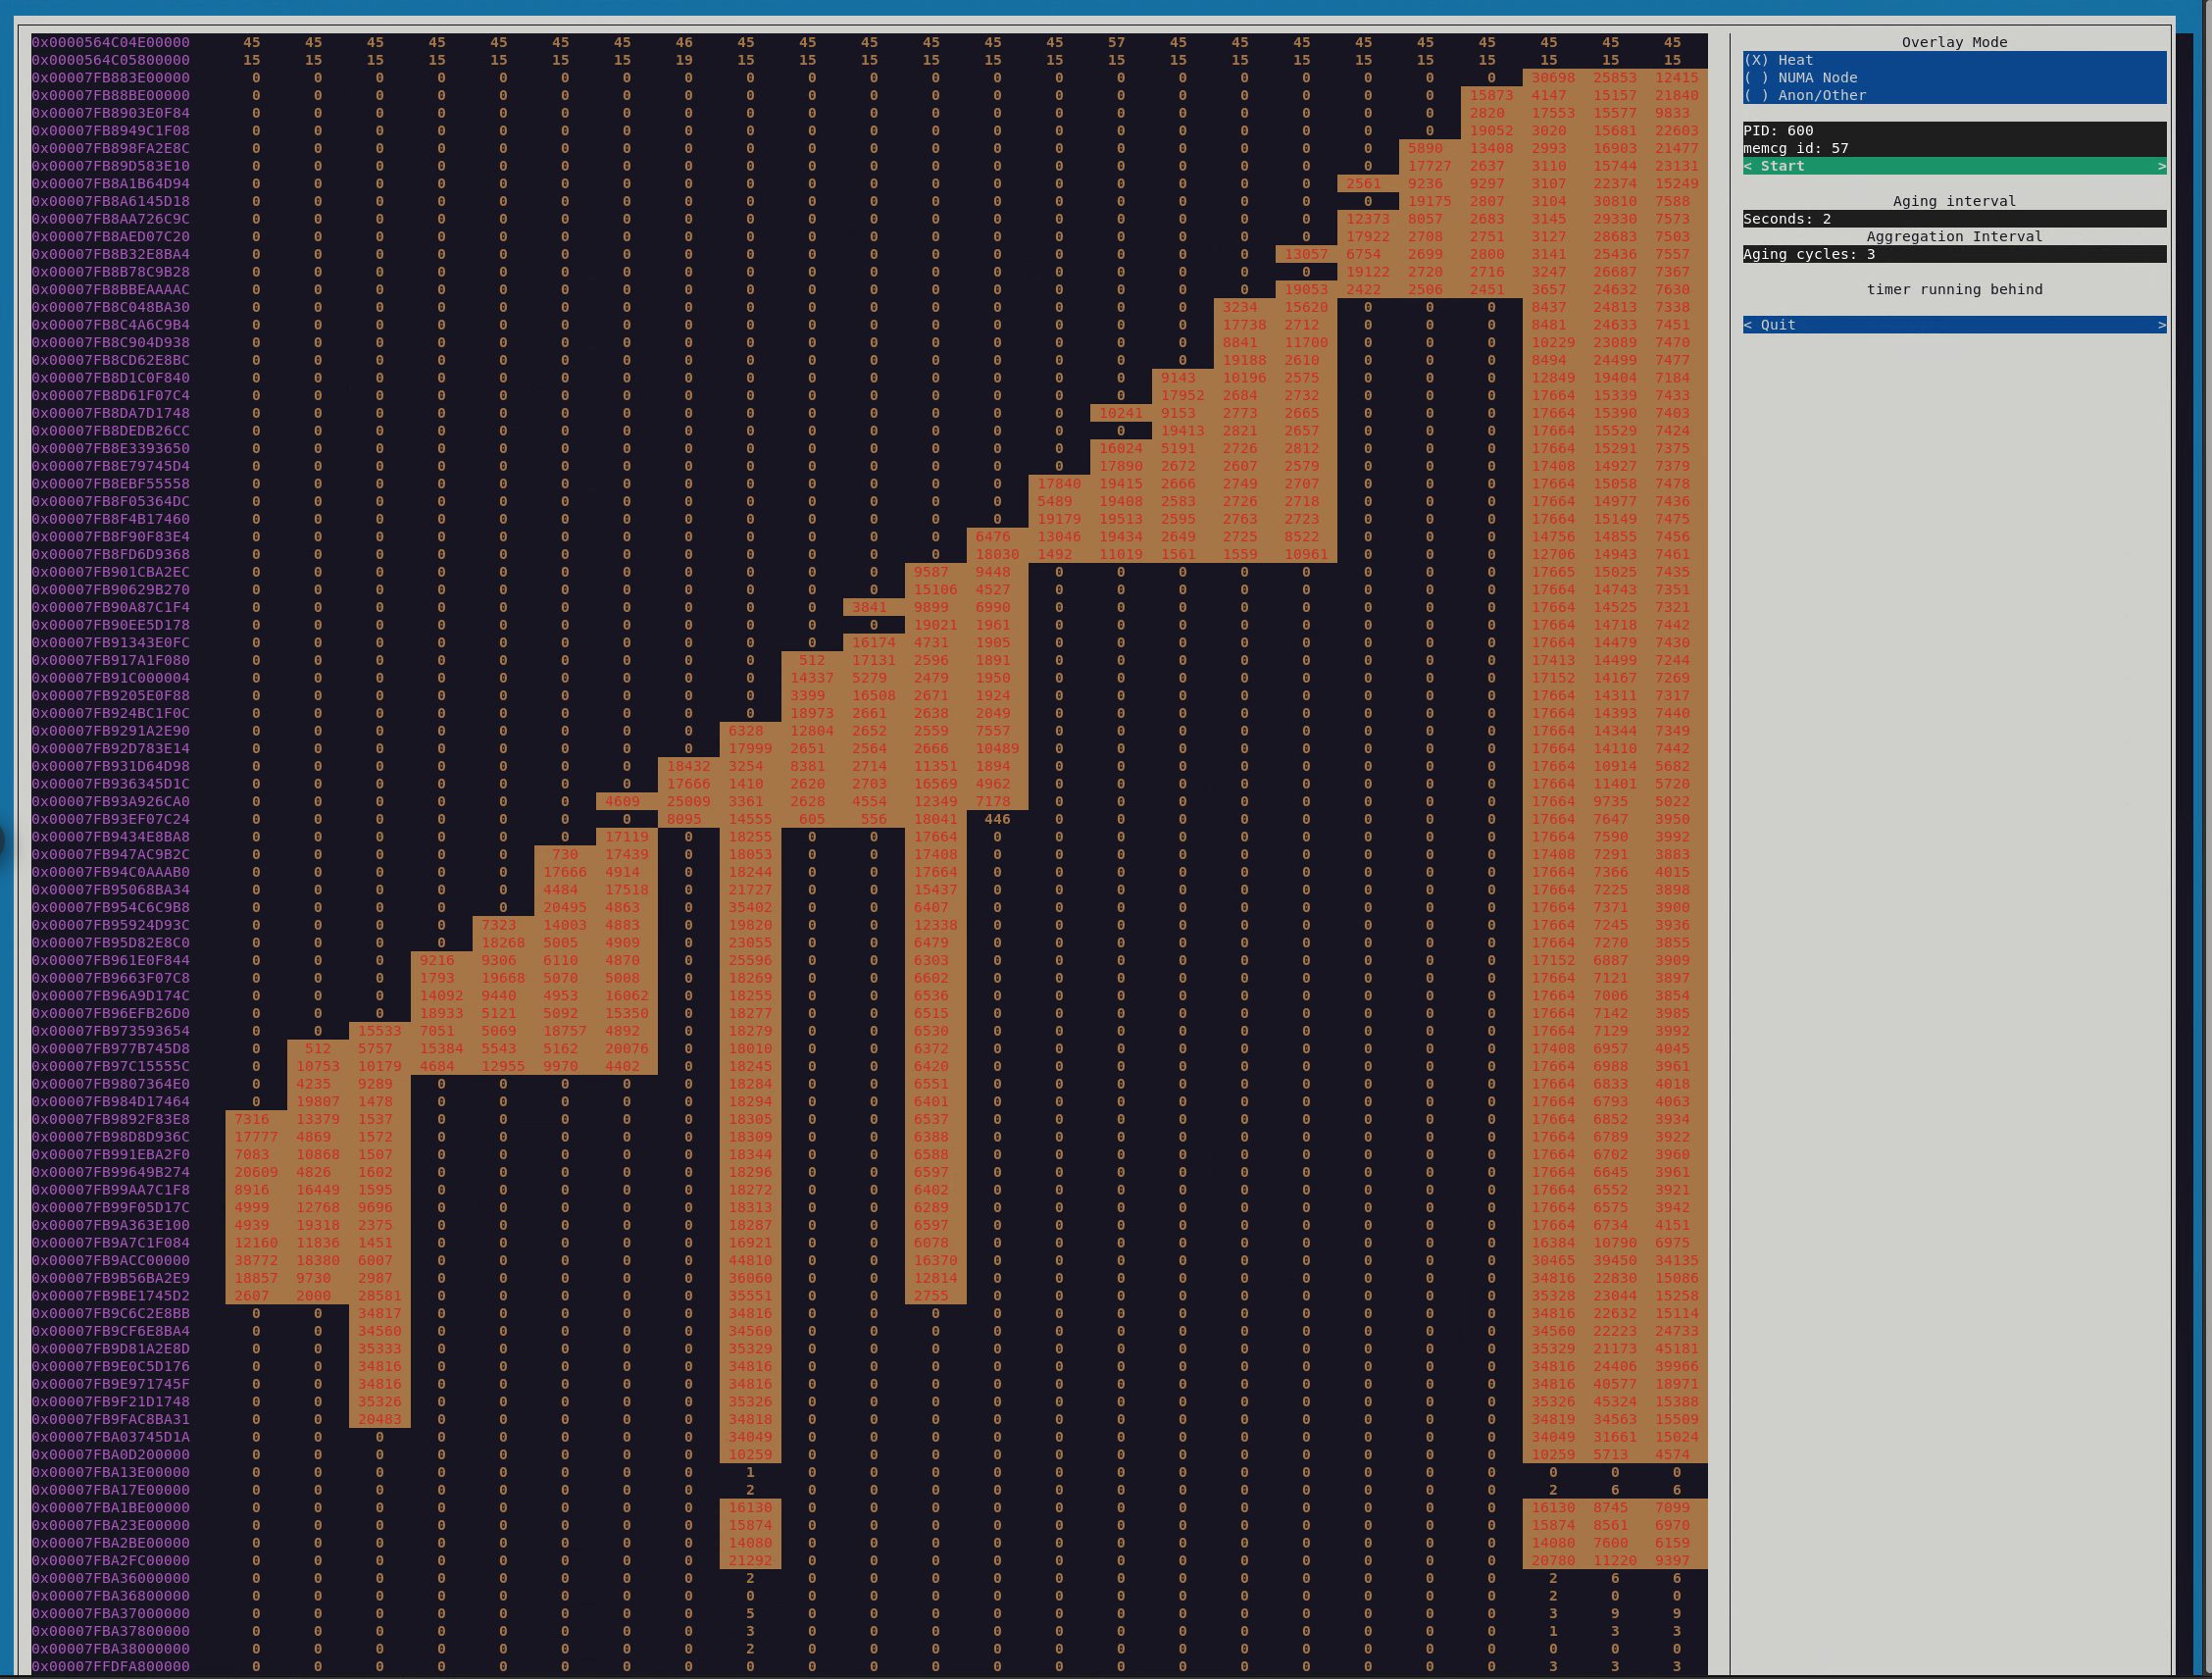
We demonstrate feasibility with a proof-of-concept that prints a live
heatmap of a process, with configurable MGLRU aging intervals and
aggregation intervals. This is a very rough PoC that still needs a lot
of work, but it shows a lot can be done by exposing page access
information from MGLRU. I will be presenting this work at the coming
LPC.
As an example. I ran the memtier benchmark[1] and captured a heatmap of
memcached being populated and running the benchmark (similar to the one
Yu posted for OpenWRT[2]):
$ cat ./run_memtier_benchmark.sh
run_memtier_benchmark()
{
# populate dataset
memtier_benchmark/memtier_benchmark -s 127.0.0.1 -p 11211 \
-P memcache_binary -n allkeys -t 1 -c 1 --ratio 1:0 --pipeline 8 \
--key-minimum=1 --key-maximum=$2 --key-pattern=P:P \
-d 1000
# access dataset using Guassian pattern
memtier_benchmark/memtier_benchmark -s 127.0.0.1 -p 11211 \
-P memcache_binary --test-time $1 -t 1 -c 1 --ratio 0:1 \
--pipeline 8 --key-minimum=1 --key-maximum=$2 \
--key-pattern=G:G --randomize --distinct-client-seed
# collect results
}
run_duration_secs=3600
max_key=8000000
run_memtier_benchmark $run_duration_secs $max_key
In the following screenshot we can see the process of populating the
dataset and accessing the dataset:
https://services.google.com/fh/files/events/memcached_memtier_startup.png
Patch 1 adds the infrastructure to enable BPF programs to monitor page
access bit harvesting
Patch 2 includes a proof-of-concept python TUI program displaying online
per-process heatmaps.
[1] https://github.com/RedisLabs/memtier_benchmark
[2] https://lore.kernel.org/all/20220831041731.3836322-1-yuzhao@xxxxxxxxxx/
Yuanchu Xie (2):
mm: multi-gen LRU: support page access info harvesting with eBPF
mm: add a BPF-based per-process heatmap tool
include/linux/mmzone.h | 1 +
mm/vmscan.c | 154 ++++++++
tools/vm/heatmap/Makefile | 30 ++
tools/vm/heatmap/heatmap.bpf.c | 123 +++++++
tools/vm/heatmap/heatmap.user.c | 188 ++++++++++
tools/vm/heatmap/heatmap_tui.py | 600 ++++++++++++++++++++++++++++++++
6 files changed, 1096 insertions(+)
create mode 100644 tools/vm/heatmap/Makefile
create mode 100644 tools/vm/heatmap/heatmap.bpf.c
create mode 100644 tools/vm/heatmap/heatmap.user.c
create mode 100755 tools/vm/heatmap/heatmap_tui.py
--
2.37.2.789.g6183377224-goog
