Moses
2012/11/26 Moisés Barba Pérez <mbarperoi@xxxxxxxxx>
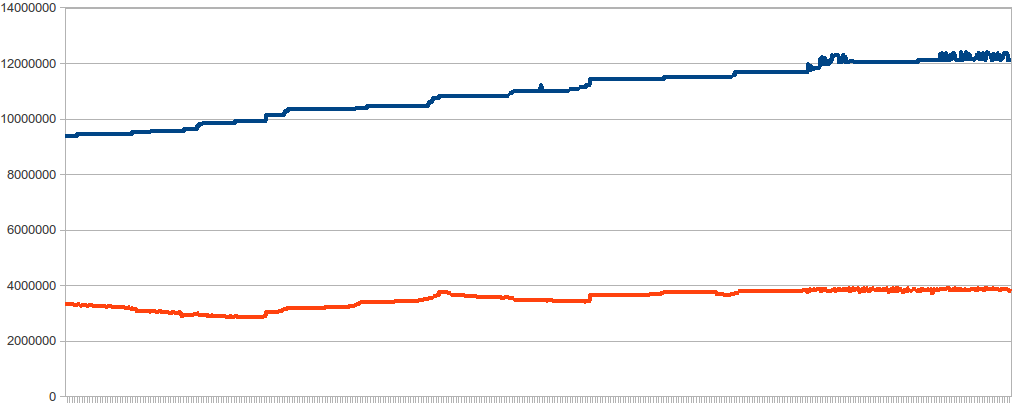
Hi,This is the end of graph I have get whit the command (while true; do ps -o 'vsz,rss' <PID>; sleep 60; done). Looks like there is not a big increase at any point. I had set swappiness to 10 and the ns-slapd lives for 2 days approx.Any idea?Regards, Moses.2012/11/23 Moisés Barba Pérez <mbarperoi@xxxxxxxxx>I'm monitoring it right now, sending it on monday.Anyway, is there any tunning configuration for number of connections, memory, etc... that I can follow?? I have use https://access.redhat.com/knowledge/docs/en-US/Red_Hat_Directory_Server/8.2/html/Performance_Tuning_Guide/system-tuning.html and http://directory.fedoraproject.org/wiki/Performance_Tuning but I don't know if there is some specific for serveral databases, or multiple replication agreements, or very high number of searches (I have 27 database and 60 replication agreements and about 200 searches per second at rush hours)Regards, Moses2012/11/23 Ludwig Krispenz <lkrispen@xxxxxxxxxx>
Hi,
from the data you show, the server process should never reach 11GB, so It could be that you run into a memory leak. Could you monitor process size growth ?
Start the server, prime the caches for all backends and monitor process growth, eg running regular
ps -o 'vsz,rss' <pid>
See how fast the process grows, if it is steadily or if there is a pattern and you can relate it to some cliend load.
Regards,
Ludwig
On 11/22/2012 02:33 PM, Moisés Barba Pérez wrote:
Hi,
I have been searching for memory usage in the server. This are the results:
389-ds 1.2.5 in a CentOS 5.5 64bits 4GB ram and 6GB swap
* The ns-slapd proccess reaches 11GB of virtual memory. pmap shows multiple [anon] using the bigger part of that 11G virtual memory. I think the [anon] are memory reservation from malloc and mmap but I don't know what call this.
* Looking for cachememsize using this search for one of the database
ldapsearch -H ldaps://localhost -x -LLL -b "cn=monitor,cn=o_xxxx,cn=ldbm database,cn=plugins,cn=config" -D "cn=Directory Manager" -W "(objectclass=*)" | grep entrycacheEnter LDAP Password:entrycachehitratio: 99
currententrycachesize: 49973691maxentrycachesize: 125829120currententrycachecount: 6521maxentrycachecount: -1
I have prime that database searching all entries with -> ldapsearch -H ldaps://localhost -x -LLL -b "o=cabu,dc=sacyl,dc=es" -D "cn=directory manager" -W "(objectclass=*)" 1.1 | grep dn: | wc -lThe result is 7610 entries in that database, so looking the monitor again:
currententrycachesize: 59315175maxentrycachesize: 125829120currententrycachecount: 7611
The id2entry.db4 for that database is 59539456 so I guess I can reduce the cachememsize from 125829120 to about 60000000 Correct me if I am wrong.And the same for all the another database.
* Now dbcachesize:
ldapsearch -H ldaps://localhost -x -LLL -b "cn=monitor, cn=ldbm database, cn=plugins,cn=config" -D "cn=Directory Manager" -W "(objectclass=*)" | grep dbcacheEnter LDAP Password:dbcachehits: 1440910461dbcachetries: 1440919648dbcachehitratio: 99dbcachepagein: 9187dbcachepageout: 128041dbcacheroevict: 9265dbcacherwevict: 0
In some place I have read that dbcacheroevict and dbcachepageout should be 0 or increase the dbcachesize but if the ratio is 99 that should be ok, right?
The thing is, if i search with db_stat for cache statistics says ratio=99
db_stat -h /var/lib/dirsrv/slapd-xxx/db/ -m0 Total cache size1 Number of caches800MB Pool individual cache size0 Maximum memory-mapped file size0 Maximum open file descriptors0 Maximum sequential buffer writes0 Sleep after writing maximum sequential buffers0 Requested pages mapped into the process' address space1448M Requested pages found in the cache (99%)9588 Requested pages not found in the cache112 Pages created in the cache9588 Pages read into the cache129932 Pages written from the cache to the backing file9668 Clean pages forced from the cache1 Dirty pages forced from the cache0 Dirty pages written by trickle-sync thread98066 Current total page count98005 Current clean page count61 Current dirty page count131071 Number of hash buckets used for page location1447M Total number of times hash chains searched for a page (1447895423)5 The longest hash chain searched for a page2819M Total number of hash buckets examined for page location (2819107178)932 The number of hash bucket locks that required waiting (0%)86 The maximum number of times any hash bucket lock was waited for1 The number of region locks that required waiting (0%)9728 The number of page allocations60012 The number of hash buckets examined during allocations1381 The maximum number of hash buckets examined for an allocation9669 The number of pages examined during allocations1 The max number of pages examined for an allocation
If I look for an index like inetuserstatus (pres and eq) I get "Requested pages found in the cache" less than 99% so I search for "inetuserstatus=*" (pres) and "inetuserstatus=active", "inetuserstatus=inactive" (eq) but the "requested pages" don't reaches the 99 or 100% and there is no more possibilities for that index.
The thing is, why ns-sldapd is growing to consume all the swap and all the ram memory the SO lets it.Any idea or suggestion???
2012/11/15 Ludwig Krispenz <lkrispen@xxxxxxxxxx>
you could use
ldapsearch ... -b "cn=ldbm database,cn=plugins,cn=config" "cn=monitor" currententrycachesize
to monitor the usage of the entrycache.
But be aware that the process uses more memory than just the caches and the memory manager can also generate some overhead.
Regards,
Ludwig
On 11/15/2012 02:55 PM, Moisés Barba Pérez wrote:
yes, thats correct, but shouldn't use all that memory because don't need so much memory
2012/11/15 Ludwig Krispenz <lkrispen@xxxxxxxxxx>
Hi,
On 11/15/2012 01:54 PM, Moisés Barba Pérez wrote:
do you mean you have 26 db backends with 125MB entrycache each ? So you would reach 3.2GB for entrycache and 800MB dbcache.Hi,
I have a memory issue with 389-ds 1.2.5 in a CentOS 5.5 64bits 4GB ram.
The server swaps when the server physical memory increase over 75% approx. When the swap is full the server reaches 100% of physical memory and the SO kills the ns-ldapd process.
Out of memory: Killed process 30383, UID 99, (ns-slapd).
The cache sizes are:
nsslapd-dbcachesize: 838860800nsslapd-import-cachesize: 20000000nsslapd-cachememsize: 125829120 (for each 26 db)
Regards,
Ludwig
Which can be the problem?
--
389 users mailing list
389-users@xxxxxxxxxxxxxxxxxxxxxxx
https://admin.fedoraproject.org/mailman/listinfo/389-users
--
389 users mailing list
389-users@xxxxxxxxxxxxxxxxxxxxxxx
https://admin.fedoraproject.org/mailman/listinfo/389-users
--
389 users mailing list
389-users@xxxxxxxxxxxxxxxxxxxxxxx
https://admin.fedoraproject.org/mailman/listinfo/389-users
--
389 users mailing list
389-users@xxxxxxxxxxxxxxxxxxxxxxx
https://admin.fedoraproject.org/mailman/listinfo/389-users
-- 389 users mailing list 389-users@xxxxxxxxxxxxxxxxxxxxxxx https://admin.fedoraproject.org/mailman/listinfo/389-users
--
389 users mailing list
389-users@xxxxxxxxxxxxxxxxxxxxxxx
https://admin.fedoraproject.org/mailman/listinfo/389-users
-- 389 users mailing list 389-users@xxxxxxxxxxxxxxxxxxxxxxx https://admin.fedoraproject.org/mailman/listinfo/389-users

